


前言
在K8S上部署prometheus-stack,k8s上的各个资源指标展示台都已经提前放在grafana上了,可以减少在grafana上添加各个控制台的时间,专心研究其他中间件和外部服务器的监控告警需求。
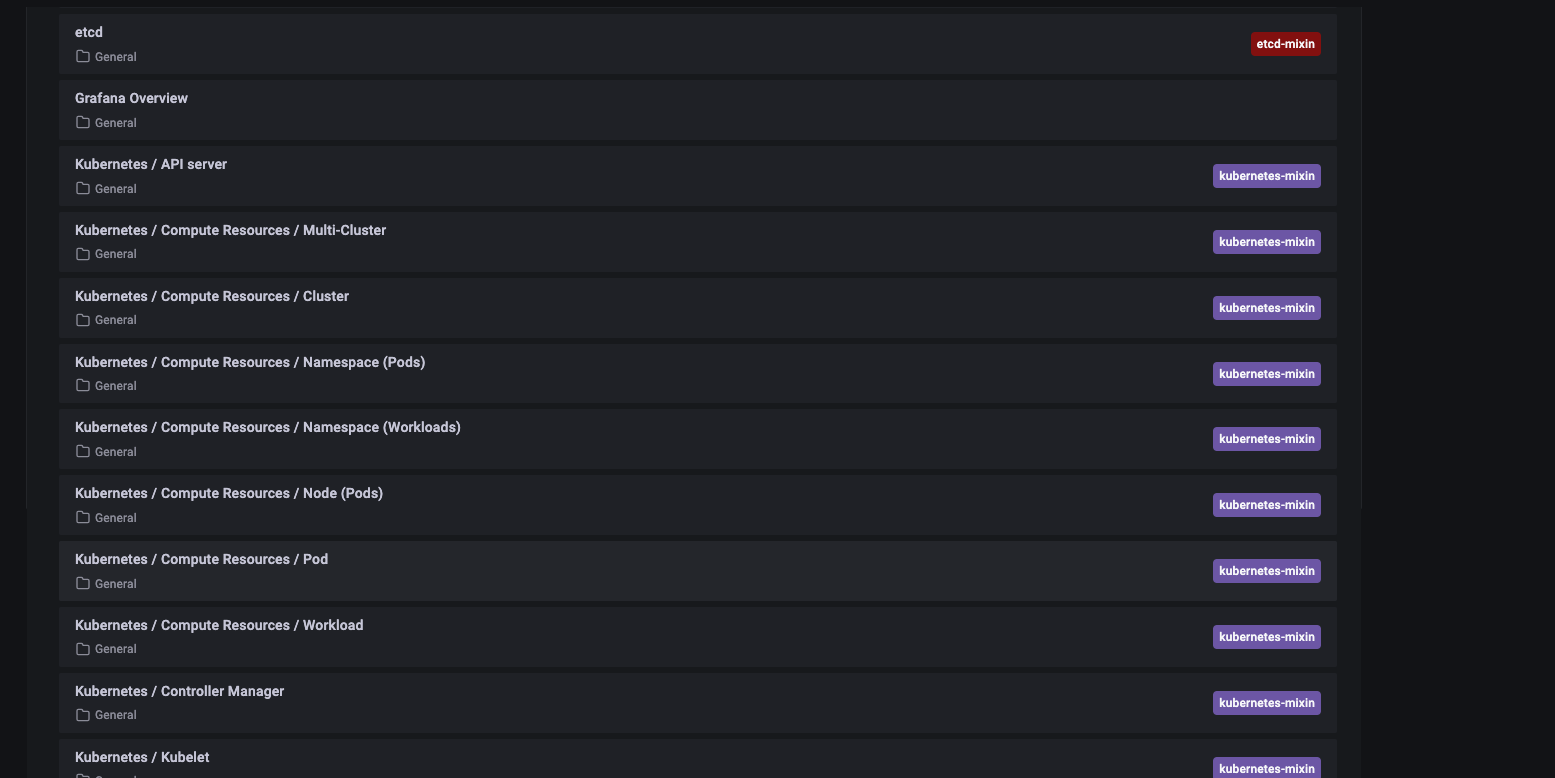
这些在prometheus-stack部署完成后已经集成到里面的grafana上了。
一.部署
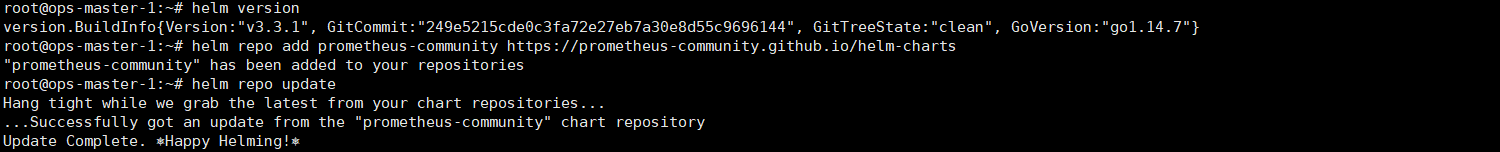
1.配置helm仓库
helm repo add prometheus-community https://prometheus-community.github.io/helm-charts
helm repo update
2.安装prometheus
kubectl create ns monitoring
helm -n monitoring install  kube-prometheus-stack prometheus-community/kube-prometheus-stack
3.查看prometheus版本
kubectl get prometheuses -n monitoring

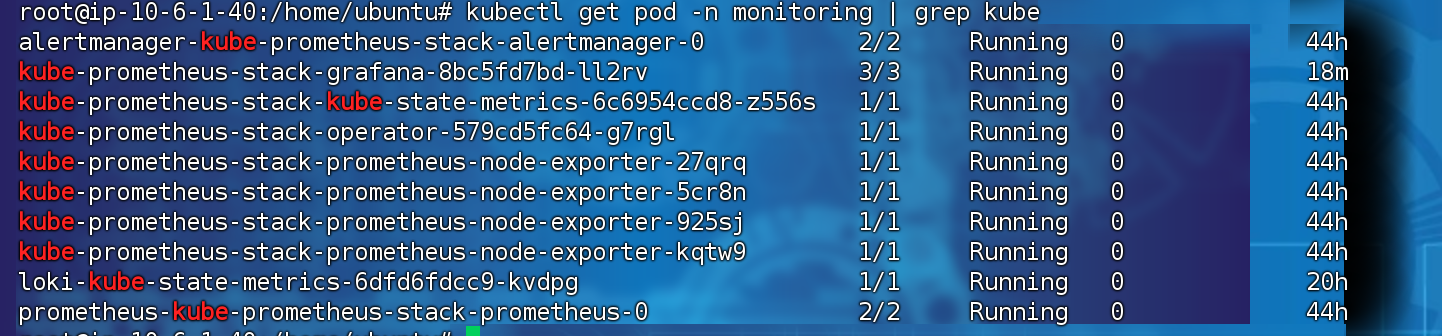
4.查看安装pod
kubectl get pods -n monitoring
二.配置grafana
1.登录grafana
通过一些api网关的设置,将grafana服务映射出来

2.查询grafana的初始密码
kubectl get secret --namespace monitoring kube-prometheus-stack-grafana -o jsonpath="{.data.admin-password}" | base64 --decode; echo
3.在kube-promeheus-stack上定义grafana的版本
在后期,因为其他监控需求的增加,一定会频繁的更改prometheus-stack的配置文件。因此我在部署前期就需要新建一个项目目录用来存放kube-prometheus-stack项目文件
helm pull prometheus-community/kube-prometheus-stack
更新项目的命令也先放出来:(可以做成一个脚本放在项目目录上,方便每次更新)
helm upgrade kube-prometheus-stack . -n monitoring
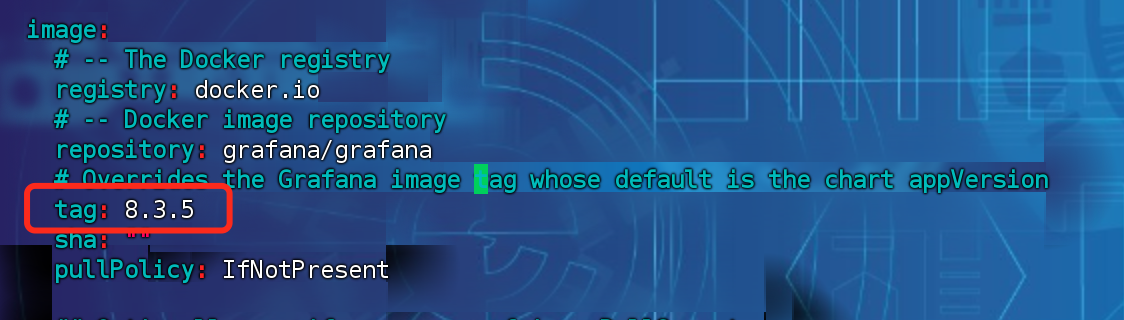
3-1.定义grafana的版本
原因:因为prometheus-stack自带的grafana的版本过高,影响loki的添加,需要grafana 版本低于等于v8.5.3(如果后期修复可以无视)
在kube-promtheus-stack中,grafana的版本定义被放在了./charts/grafana的子chart包中,所以只需要找到这个子chart包的values.yaml里面将版本写死就可以了。
三.在prometheus-stack中如何监控集群外部的主机或者中间件exporter
3-1.在Linux主机上安装Node Exporter
在要监控的Linux主机上安装Node Exporter。为了快速验证,这里选择docker部署的方式:
docker run -itd --name=node-exporter -p 9100:9100 --restart always --privileged=true --net="host" --pid="host" -v "/:/host:ro,rslave" prom/node-exporter:latest --path.rootfs=/host
3-2.配置Prometheus-stack监控Node Exporter
编辑Prometheus-stack的values.yamle文件。以下是通过Helm chart配置的示例:
# values.yaml
prometheus:
  prometheusSpec:
    additionalScrapeConfigs:
      - job_name: 'node-exporter'
        static_configs:
          - targets:
            - 'linux_host_ip:9100'

建议直接搜索additionalScrapeConfigs 可以快速找出位置。
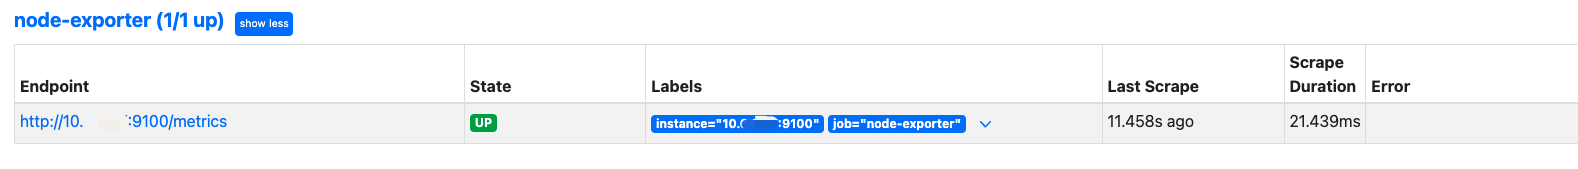
helm upgrade之后在prometheus上可以看到节点就可以了
3-3.配置监控告警文件
apiVersion: monitoring.coreos.com/v1
kind: PrometheusRule
metadata:
  labels:
    app: kube-prometheus-stack
    release: kube-prometheus-stack
  name: nodes.rules
  namespace: default
spec:
  groups:
  - name: nodes
    rules:
    - alert: OutOfMemory
      expr: (node_memory_MemFree_bytes + node_memory_Cached_bytes + node_memory_Buffers_bytes) / node_memory_MemTotal_bytes * 100 < 10
      for: 5m
      labels:
        severity: critical
        k8s: nodes
      annotations:
        summary: "Out of memory (instance {{ $labels.instance }})"
        description: "Node memory is filling up (< 10% left).  VALUE = {{ $value }}.  LABELS: {{ $labels }}"
    - alert: UnusualNetworkThroughputIn
      expr: sum by (instance) (irate(node_network_receive_bytes_total[2m])) / 1024 / 1024 > 100
      for: 10m
      labels:
        severity: warning
        k8s: nodes
      annotations:
        summary: "Unusual network throughput in (instance {{ $labels.instance }})"
        description: "Host network interfaces are probably receiving too much data (> 100 MB/s).  VALUE = {{ $value }}.  LABELS: {{ $labels }}"
    - alert: UnusualNetworkThroughputOut
      expr: sum by (instance) (irate(node_network_transmit_bytes_total[2m])) / 1024 / 1024 > 100
      for: 10m
      labels:
        severity: warning
        k8s: nodes
      annotations:
        summary: "Unusual network throughput out (instance {{ $labels.instance }})"
        description: "Host network interfaces are probably sending too much data (> 100 MB/s).  VALUE = {{ $value }}.  LABELS: {{ $labels }}"
    - alert: UnusualDiskReadRate
      expr: sum by (instance) (irate(node_disk_read_bytes_total[2m])) / 1024 / 1024 > 50
      for: 20m
      labels:
        severity: warning
        k8s: nodes
      annotations:
        summary: "Unusual disk read rate (instance {{ $labels.instance }})"
        description: "Disk is probably reading too much data (> 50 MB/s).  VALUE = {{ $value }}.  LABELS: {{ $labels }}"
    - alert: UnusualDiskWriteRate
      expr: sum by (instance) (irate(node_disk_written_bytes_total[2m])) / 1024 / 1024 > 50
      for: 20m
      labels:
        severity: warning
        k8s: nodes
      annotations:
        summary: "Unusual disk write rate (instance {{ $labels.instance }})"
        description: "Disk is probably writing too much data (> 50 MB/s).  VALUE = {{ $value }}.  LABELS: {{ $labels }}"
    - alert: OutOfDiskSpace
      expr: node_filesystem_free_bytes{mountpoint ="/rootfs"} / node_filesystem_size_bytes{mountpoint ="/rootfs"} * 100 < 10
      for: 20m
      labels:
        severity: high
        k8s: nodes
      annotations:
        summary: "Out of disk space (instance {{ $labels.instance }})"
        description: "Disk is almost full (< 10% left).  VALUE = {{ $value }}.  LABELS: {{ $labels }}"
    - alert: OutOfInodes
      expr: node_filesystem_files_free{mountpoint ="/rootfs"} / node_filesystem_files{mountpoint ="/rootfs"} * 100 < 10
      for: 30m
      labels:
        severity: high
        k8s: nodes
      annotations:
        summary: "Out of inodes (instance {{ $labels.instance }})"
        description: "Disk is almost running out of available inodes (< 10% left).  VALUE = {{ $value }}.  LABELS: {{ $labels }}"
    - alert: UnusualDiskReadLatency
      expr: rate(node_disk_read_time_seconds_total[1m]) / rate(node_disk_reads_completed_total[1m]) > 100
      for: 30m
      labels:
        severity: high
        k8s: nodes
      annotations:
        summary: "Unusual disk read latency (instance {{ $labels.instance }})"
        description: "Disk latency is growing (read operations > 100ms).  VALUE = {{ $value }}.  LABELS: {{ $labels }}"
    - alert: UnusualDiskWriteLatency
      expr: rate(node_disk_write_time_seconds_total[1m]) / rate(node_disk_writes_completed_total[1m]) > 100
      for: 30m
      labels:
        severity: high
        k8s: nodes
      annotations:
        summary: "Unusual disk write latency (instance {{ $labels.instance }})"
        description: "Disk latency is growing (write operations > 100ms).  VALUE = {{ $value }}.  LABELS: {{ $labels }}"
    - alert: CpuLoad
      expr: node_load15 / (count without (cpu, mode) (node_cpu_seconds_total{mode="system"})) > 4
      for: 20m
      labels:
        severity: high
        k8s: nodes
      annotations:
        summary: "CPU load (instance {{ $labels.instance }})"
        description: "CPU load (15m) is high.  VALUE = {{ $value }}.  LABELS: {{ $labels }}"
    - alert: ContextSwitching
      expr: rate(node_context_switches_total[5m]) > 10000
      for: 30m
      labels:
        severity: warning
        k8s: nodes
      annotations:
        summary: "Context switching (instance {{ $labels.instance }})"
        description: "Context switching is growing on node (> 10000 / s).  VALUE = {{ $value }}.  LABELS: {{ $labels }}"
    - alert: NodeHasSwap
      expr: node_memory_SwapTotal_bytes > 0
      for: 30m
      labels:
        severity: warning
        k8s: nodes
      annotations:
        summary: "Node has swap (instance {{ $labels.instance }})"
        description: "Node has swap.  VALUE = {{ $value }}.  LABELS: {{ $labels }}"
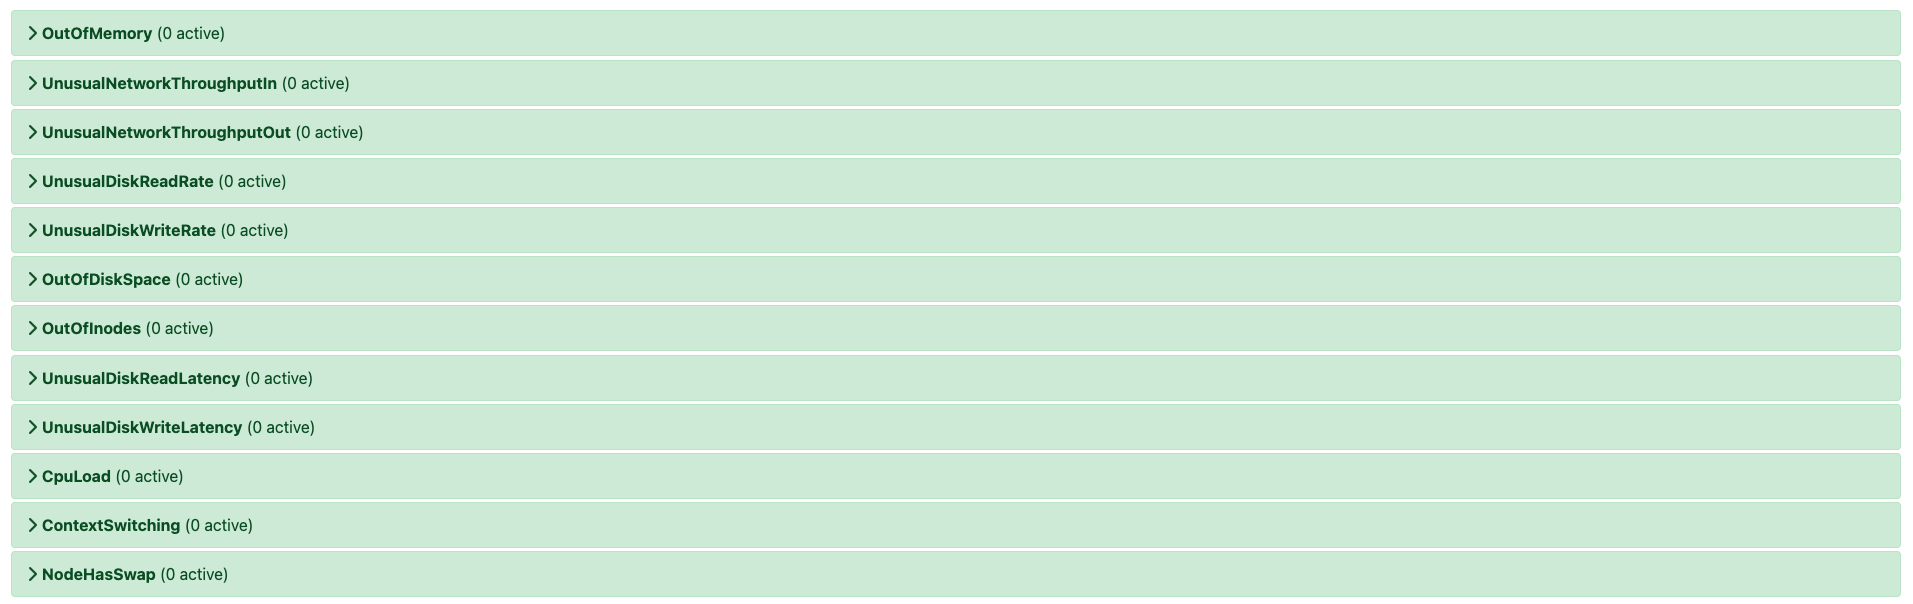
重新加载prometheus-stack,能够出现新添加的告警规则,就可以了
评论区