


系统环境: ubuntu 20.04+ 4C16G 200G空间 三个程序统一定义在/data目录下
1.1prometheus server部署
下载文件并解压
prometheus server是prometheus的核心,负责采集数据,存储数据
mkdir /data
wget  https://github.com/prometheus/prometheus/releases/download/v2.37.6/prometheus-2.37.6.linux-amd64.tar.gz
tar zvxf prometheus-2.37.6.linux-amd64.tar.gz -C /data/
mv prometheus-2.37.6.linux-amd64  /data/prometheus
cd /data/prometheus  && mkdir log
修改prometheus配置文件
1.vim prometheus.yml
# my global config
global:
  scrape_interval: 30s # Set the scrape interval to every 15 seconds. Default is every 1 minute.
  evaluation_interval: 25s # Evaluate rules every 15 seconds. The default is every 1 minute.
# scrape_timeout is set to the global default (10s).

# Alertmanager configuration
alerting:
  alertmanagers:
  - static_configs:
    - targets:
      - 10.13.103.152:9093                                                    # alertmanager主机地址

# Load rules once and periodically evaluate them according to the global 'evaluation_interval'.
rule_files:
# - "first_rules.yml"
# - "second_rules.yml"
  - "/data/prometheus/rules/node_alert.yml"             # 机器节点预警规则文件
  - "/data/prometheus/rules/mysql_alert.yml"             # mysql 服务预警规则文件
  - "/data/prometheus/rules/cloudwatch_rds.yml"          # aws cloudwatch_rds监控告警规则文件


# A scrape configuration containing exactly one endpoint to scrape:
# Here it's Prometheus itself.
scrape_configs:
# The job name is added as a label `job=<job_name>` to any timeseries scraped from this config.
  - job_name: 'prometheus'
    static_configs:
     - targets: ['localhost:9090']
  - job_name: 'xxx-cloudwatch'   #job_name名称会影响指标labels.job的抓取
    static_configs:
    - targets: ['localhost:9106']

  - job_name: 'GICHOST'                    #这里相当于给主机分类了,如果需要分类,只能要指定不同的job_name
    file_sd_configs:
       - files: ['./host.json']                          # 被监控的主机,可以通过static_configs罗列所有机器,这里通过file_sd_configs参数加载文件的形式读取

# 被监控的主机,可以json或yaml格式书写,我这里以json格式书写,target里面写监控机器的ip,labels非必须,可以由你自己定义
1.vim host.json
[
{
"targets":[
"10.13.101.131:9100",
"10.13.101.132:9100",
"10.13.103.251:9100"
],
"labels":{
"host":"GIC_node"
}
},

{
"targets":[
"10.13.101.10:9100",
"10.13.101.11:9100",
"10.13.103.22:9100"
],
"labels":{
"service":"web"
}
}
]
配置节点预警规则,具体告警规则如下:
root@prometheus:/data/prometheus-2.4.3# mkdir rules
root@prometheus:/data/prometheus-2.4.3# cd rules
root@prometheus:/data/prometheus-2.4.3/rules# touch node_alert.yml
节点预警规则
vim node_alert.yml
groups:
- name: ID-主机告警规则
  rules:
  - alert: ID-机器状态告警
    #expr: avg(up)by(instance,job,service) == 0
    expr: up== 0
    for: 30s
    labels:
      status: 紧急
    annotations:
      summary: "服务器未响应"
      description: "注意!服务器{{$labels.job }}宕机,请立即处理"
  - alert: ID-机器CPU使用预警
    expr: round(100 - (avg by (instance,job)(irate(node_cpu_seconds_total{mode="idle"}[1m]) )) * 100,2) > 95
    for: 1m
    labels:
      status: 严重
    annotations:
      summary: "请注意!机器CPU使用率过高!"
      description: "机器{{$labels.job }}CPU使用大于95%(目前使用:{{ $value }}%)"
  - alert: ID-机器cpu负载预警
    expr: round(100 - (avg(irate(node_cpu_seconds_total{ mode="idle"}[1m])) by(instance,app,job) * 100),2) > 90
    for: 2m
    labels:
      statue: 严重
        #wcgroup: wechat-warning
    annotations:
      summary: "机器CPU负载 > 90%"
      description: "VALUE: {{ $value }} LABELS: {{ $labels }}"
  - alert: ID-机器内存使用预警
    expr: round((node_memory_MemTotal_bytes - (node_memory_MemFree_bytes+node_memory_Buffers_bytes+node_memory_Cached_bytes )) / node_memory_MemTotal_bytes * 100,2) > 90
    for: 1m
    labels:
      status: 严重
    annotations:
      description: "机器: 内存使用超过90%! (当前值:{{$value}}%)"
      summary: "请注意,机器内存使用过高"
  - alert: ID-磁盘使用空间预警
    expr: round((node_filesystem_size_bytes - node_filesystem_avail_bytes) / node_filesystem_size_bytes * 100,2) > 85
    for:  5m
    labels:
      status: 紧急
    annotations:
      summary: "请注意!磁盘使用率已达85%"
      description: "机器{{$labels.job }}磁盘空间{{$labels.mountpoint}}使用超过85%!(目前使用:{{$value}}%)"
  - alert: ID-机器IO性能预警
    expr: round(100-(avg(irate(node_disk_io_time_seconds_total[1m])) by(instance)* 100),2) < 40
    for: 20m
    labels:
      status: 紧急
    annotations:
      summary: "请注意,机器流入磁盘IO使用率过高!"
      description: "机器{{$labels.job }}流入磁盘IO小于40%(目前使用:{{$value}}%)"
  - alert: ID-机器tcp连接数过高
    expr: node_netstat_Tcp_CurrEstab{} - 0 > 20000
    for: 2m
    labels:
      status: 紧急
    annotations:
      summary: " 请注意,机器tcp连接数过高!"
      description: "机器{{$labels.job }} TCP连接数大于20000(目前使用:{{$value}})"
  #- alert: 网络流入流量预警
  #  expr: ((sum(rate (node_network_receive_bytes_total{device!~'tap.*|veth.*|br.*|docker.*|virbr*|lo*'}[5m])) by (instance)) / 1000) > 50
  #  for: 3m
  #  labels:
  #    status: 严重告警
  #  annotations:
  #    summary: "{{$labels.mountpoint}} 流入网络带宽过高!"
  #    description: "{{$labels.mountpoint }}流入网络带宽持续2分钟高于50M. RX带宽使用率{{$value}}"
  #- alert: 网络流出流量预警
  #  expr: ((sum(rate (node_network_transmit_bytes_total{device!~'tap.*|veth.*|br.*|docker.*|virbr*|lo*'}[5m])) by (instance)) / 1000) > 50
  #  for: 3m
  #  labels:
  #    status: 严重告警
  #  annotations:
  #    summary: "{{$labels.mountpoint}} 流出网络带宽过高!"
  #    description: "{{$labels.mountpoint }}流出网络带宽持续2分钟高于50M. RX带宽使用率{{$value}}"
mysql_exporter预警规则
vim mysql_alert.yml
groups:
  - name: ID-mysql服务预警
    rules:
    - alert: ID-Mysql数据库宕机
      expr: mysql_up == 0
      for: 0m
      labels:
        status: 紧急
      annotations:
        summary: MySQL 宕机 (instance {{ $labels.job }})
        description: "MySQL instance is down on {{ $labels.instance }}\n  VALUE = {{ $value }}\n  LABELS = {{ $labels }}"
    - alert: ID-Mysql连接数过多
      expr: mysql_global_status_threads_connected > 1000
      for: 0m
      labels:
        status: 严重
      annotations:
        summary: MySQL 连接数过多 (instance {{ $labels.job }})
        description: "MySQL Too Many Connections on {{ $labels.instance }}\n  VALUE = {{ $value }}\n  LABELS = {{ $labels }}"
    - alert: ID-Mysql_qps激增
      expr: round(rate(mysql_global_status_queries[15m]),2) > 600
      for: 40m
      labels:
        status: 严重
        #job: "{{ job }}"
      annotations:
        summary: MySQL (instance {{ $labels.job }}) 15分钟内处理了 > 800 次查询
        description: The mysql {{ $labels.job }} 15分钟内处理的查询次数 {{$value}}
    - alert: ID-MysqlI_tps激增
      expr: round(sum(rate(mysql_global_status_commands_total{command=~"(insert|replace|delete|update)"}[5m])) without (command),2) > 400
      for: 3m
      labels:
        status: 严重
      annotations:
        summary: MySQL (instance {{ $labels.job }}) tps is > 400
        description: The mysql TPS are a rate of {{$value}} second
cloudwatch-rds报警规则
vim cloudwatch_rds.yaml
groups:
- name: cloudwatch-rds
  rules:
  - alert: ID-rds-连接数过高
    expr: max(aws_rds_database_connections_average{}) by(job, service, dbinstance_identifier) > 1000
    for: 3m
    labels:
      status: 严重
    annotations:
      summary: "请注意,RDS DB 连接数过高"
      description: "实例RDS:{{$labels.dbinstance_identifier}}连接数超过1000,当前值:{{ $value }}"
  - alert: ID-rds-cpu使用率过高
    expr: round(max(aws_rds_cpuutilization_average{dbinstance_identifier!~"oracle-.*|oracle-arch.*"}) by(dbinstance_identifier,job),2) > 85
    for: 3m
    labels:
      status: 严重
    annotations:
      summary: "请注意,RDS CPU使用率过高"
      description: "实例RDS:{{$labels.dbinstance_identifier}}CPU使用率超过85%,当前值:{{ $value }}%"
  - alert: ID-rds-负载过大
    expr: max(aws_rds_dbload_average{dbinstance_identifier!~"otacle-.*|oracle-arch.*"}) by(dbinstance_identifier) > 20
    for: 5m
    labels:
      status: 严重
    annotations:
      summary: "请注意,RDS实例负载过大"
      description: "实例RDS:{{$labels.dbinstance_identifier}}负载大于20,当前值:{{ $value }}"
  - alert: ID-rds-存储空间不足告警
    expr: round(max(aws_rds_free_storage_space_average{dbinstance_identifier!~"oracle-arch-dot-use.*"}/1000/1000/1000) by(dbinstance_identifier,job),2)  < 200
    for: 3m
    labels:
      status: 严重
    annotations:
      summary: "请注意,RDS DB存储空间过少"
      description: "实例RDS:{{$labels.dbinstance_identifier}}存储空间小于200G,当前值:{{ $value }}G"
  #- alert: ID-rds-free-storage
  #  expr: max(aws_rds_free_storage_space_average{pod!~"prometh.*",dbinstance_identifier=~"mysql.*"}/1000/1000/1000) by(dbinstance_identifier) < 400
  #  for: 3m
  #  labels:
  #    status: error
  #    channel: slack-error
  #    #wcgroup: wechat-error
  #    pdgroup: pdg
  #  annotations:
  #    summary: "RDS DB Storge Space < 400G"
  #    description: "VALUE: {{ $value }} LABELS: {{ $labels }}"
  #- alert: ID-rds-free-storage
  #  expr: max(aws_rds_free_storage_space_average{pod!~"prometh.*",dbinstance_identifier=~"apollo-mysql.*|dataanalysis.*"}/1000/1000/1000) by(dbinstance_identifier) < 15
  #  for: 3m
  #  labels:
  #    status: error
  #    channel: slack-error
  #    #wcgroup: wechat-error
  #    pdgroup: pdg
  #  annotations:
  #    summary: "RDS DB Storge Spac let than < 15G"
  #    description: "VALUE: {{ $value }} LABELS: {{ $labels }}"
设置使用supervisor启动prometheus,可以保持promethues异常停止后自动启动,亦可以配置systemd启动prometheus
$cd /etc/supervisor/conf.d/ $vim prometheus.conf
[program:prometheus] ;程序名称,终端控制时需要的标识
command=/data/prometheus/prometheus --config.file=/data/prometheus/prometheus.yml ; 运行程序的命令
directory=/data/prometheus/ ; 命令执行的目录
autorestart=true ; 程序意外退出是否自动重启
stderr_logfile=/data/prometheus/log/prometheus.err.log ; 错误日志文件
stdout_logfile=/data/prometheus/log/prometheus.out.log ; 输出日志文件
environment=ASPNETCORE_ENVIRONMENT=Production ; 进程环境变量
user=root ; 进程执行的用户身份


stopsignal=INT
$supervisorctl start prometheus
$ supervisorctl status
1.2 node_exporter部署
以上prometheus采集到cpu,内存,磁盘的数据是通过node_exporter获取的,需要在被监控机器上部署node_exporter
下载node_exporter并解压
 wget https://github.com/prometheus/node_exporter/releases/download/v1.8.2/node_exporter-1.8.2.linux-amd64.tar.gz
tar zvxf node_exporter-1.8.2 linux-amd64.tar.gz -C /data/
mv node_exporter-1.8.2 linux-amd64.tar.gz  node_exporter
配置supervisor启动node_exporter
cd /etc/supervisor/conf.d/ vim node_exporter.conf
[program:node_exporter]
command=/data/node_exporter/node_exporter ; 运行程序的命令
directory=/data/node_exporter/ ; 命令执行的目录
autorestart=true ; 程序意外退出是否自动重启
stderr_logfile=/data/node_exporter/log/node_exporter.err.log ; 错误日志文件
stdout_logfile=/data/node_exporter/log/node_exporter.out.log ; 输出日志文件
environment=ASPNETCORE_ENVIRONMENT=Production ; 进程环境变量
user=root ; 进程执行的用户身份


stopsignal=INT
supervisorctl start node_exporter
supervisorctl status
此时我们可以登录prometheus默认的web http://10.13.103.151:9090查看监控数据了
1.3 alertmanager server部署
当我们设置的报警值超标后,prometheus触发报警alert,并传递给alertmanager,alertmanager给我们发送告警通知
下载alertmanager并解压
cd /data/
wget https://github.com/prometheus/alertmanager/releases/download/v0.22.2/alertmanager-0.22.2.linux-amd64.tar.gz
tar zvxf  alertmanager-0.22.2.linux-amd64.tar.gz
mv alertmanager-0.22.2 alertmanager
cd /alertmanager && mkdir log
修改alertmanager配置文件
vim alertmanager.yml
global:
resolve_timeout: 5m
# The smarthost and SMTP sender used for mail notifications. # 设置邮件发送的相关信息,根据你实际的邮件账号和密码设置
smtp_smarthost: 'smtp.exmail.qq.com:25'
smtp_from: 'alert@test.com'
smtp_auth_username: 'alert@test.com'
smtp_auth_password: '*********'
smtp_require_tls: false
templates:
- '/data/alertmanager/template/*.tmpl'
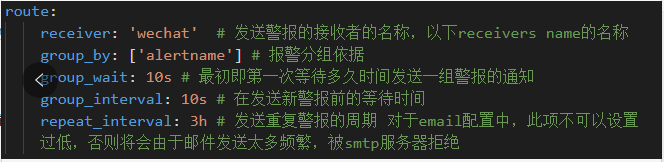
route:
group_by: ['alertname']
group_wait: 10s
group_interval: 10s
repeat_interval: 4h
receiver: 'mail'
receivers:
- name: 'mail'
email_configs:
- to: 'test1@rylink.com'
- to: 'test@qq.com'
send_resolved: true
- name: 'wiki'
email_configs:
- to: 'test@163.com'
send_resolved: true
inhibit_rules:
- source_match:
severity: 'critical'
target_match:
severity: 'warning'
equal: ['alertname', 'dev', 'instance']
由于默认的微信发送格式比较乱,这里我们设置微信的格式模板,邮件采用默认的格式
cd template/ vim wechat.tmpl
{{ define "wechat.default.message" }}
{{- if gt (len .Alerts.Firing) 0 -}}
{{- range $index, $alert := .Alerts -}}
{{- if eq $index 0 }}
=======异常告警=======
[告警类型]: {{ $alert.Labels.alertname }}
[告警状态]:{{ $alert.Labels.status }}
[告警主题]:{{ $alert.Annotations.summary }}
[告警详情]:{{ $alert.Annotations.description }}
[故障时间]: {{ ($alert.StartsAt.Add 28800e9).Format "2006-01-02 15:04:05" }}
{{- if gt (len $alert.Labels.instance) 0 }}
[实例信息]: {{ $alert.Labels.instance }}
{{- end }}
{{- if gt (len $alert.Labels.namespace) 0 }}
[命名空间]: {{ $alert.Labels.namespace }}
{{- end }}
{{- if gt (len $alert.Labels.node) 0 }}
[节点信息]: {{ $alert.Labels.node }}
{{- end }}
{{- if gt (len $alert.Labels.pod) 0 }}
[实例名称]: {{ $alert.Labels.pod }}
{{- end }}
=======END==========
{{- end }}
{{- end }}
{{- end }}
{{- if gt (len .Alerts.Resolved) 0 -}}
{{- range $index, $alert := .Alerts -}}
{{- if eq $index 0 }}
=======异常恢复========
[告警类型]: {{ $alert.Labels.alertname }}
[告警级别]: {{ $alert.Labels.severity }}
[告警主题]:{{ $alert.Annotations.summary }}
[告警详情]:{{ $alert.Annotations.description }}
[故障时间]: {{ ($alert.StartsAt.Add 28800e9).Format "2006-01-02 15:04:05" }}
[恢复时间]: {{ ($alert.EndsAt.Add 28800e9).Format "2006-01-02 15:04:05" }}
{{- if gt (len $alert.Labels.instance) 0 }}
[实例信息]: {{ $alert.Labels.instance }}
{{- end }}
{{- if gt (len $alert.Labels.namespace) 0 }}
[命名空间]: {{ $alert.Labels.namespace }}
{{- end }}
{{- if gt (len $alert.Labels.node) 0 }}
[节点信息]: {{ $alert.Labels.node }}
{{- end }}
{{- if gt (len $alert.Labels.pod) 0 }}
[实例名称]: {{ $alert.Labels.pod }}
{{- end }}
========END=========
{{- end }}
{{- end }}
{{- end }}
{{- end }}
评论区