


前言:假定kafka已经安装成功了,现在开启kafka的jmx端口,然后调取jmx_prometheus.jar包,然后直接被prometheus调用使用。
1.在kafka的安装目录bin下找到启动脚本kafka-run-class.sh
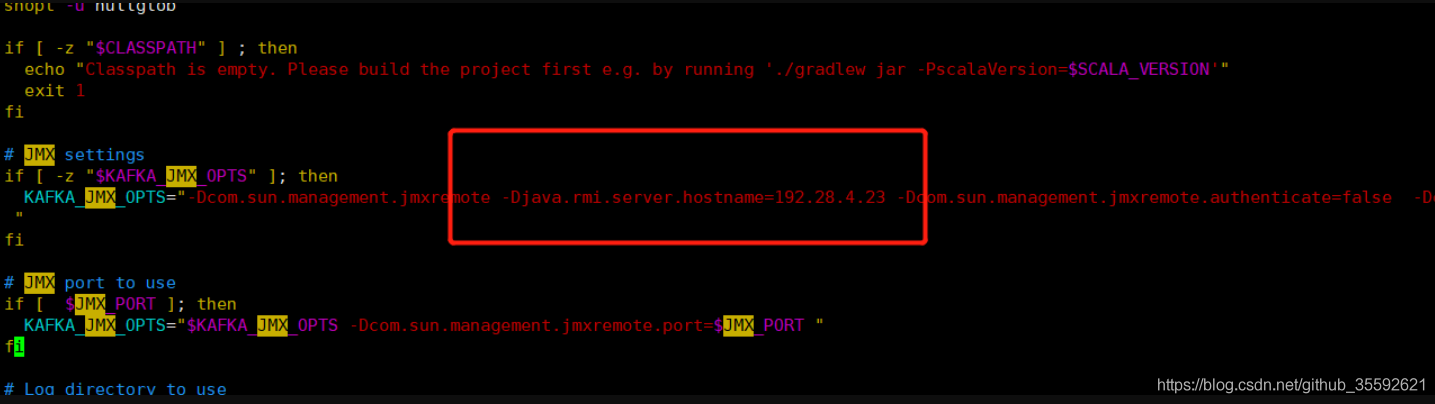
2.编辑kafka-run-class.sh
JMX_PORT=9999
export KAFKA_OPTS=“-javaagent:/opt/kafka_2.2/jmx_prometheus_javaagent-0.18.2.jar=9990:/opt/kafka_2.2.1/kafka-agent.yaml”
#在JMX setting中添加以下参数:
-Djava.rmi.server.hostname=本机ip //在kafka_JMX_OPS中新增指明本机ip
3.下载jmx_exporter
链接 https://github.com/prometheus/jmx_exporter, 将文件放在kafka目录下 比如 /kafka_2.11-1.0.0/jmx_prometheus_javaagent-0.3.1.jar
进去项目目录后,运行
./mvnw package
构建jmx_prometheus_javaagent-0.18.2.jar的jar包 项目目录在 绝对路径/jmx_exporter/jmx_prometheus_javaagent/target/jmx_prometheus_javaagent-0.18.2.jar
将jmx_prometheus_javaagent-0.18.2.jar包拷贝到/opt/kafka_2.2/目录下,满足kafka-run-class.sh的jar包位置。
4.创建文件kafka-agent.yaml
放在目录 /kafka_2.11-1.0.0, 里面的内容就是你配置的kafka metrics
hostPort: 127.0.0.1:9999
lowercaseOutputName: true
whitelistObjectNames:
  - "kafka.controller:type=KafkaController,name=OfflinePartitionsCount"
  - "kafka.controller:type=KafkaController,name=ActiveControllerCount"
  - "kafka.server:type=BrokerTopicMetrics,name=MessagesInPerSec"
  - "kafka.server:type=BrokerTopicMetrics,name=BytesInPerSec"
  - "kafka.server:type=ReplicaManager,name=UnderReplicatedPartitions"
  - "kafka.server:type=ReplicaFetcherManager,name=MaxLag,clientId=Replica"

###
lowercaseOutputName: true

rules:
# Special cases and very specific rules
- pattern : kafka.server<type=(.+), name=(.+), clientId=(.+), topic=(.+), partition=(.*)><>Value
  name: kafka_server_$1_$2
  type: GAUGE
  labels:
    clientId: "$3"
    topic: "$4"
    partition: "$5"
- pattern : kafka.server<type=(.+), name=(.+), clientId=(.+), brokerHost=(.+), brokerPort=(.+)><>Value
  name: kafka_server_$1_$2
  type: GAUGE
  labels:
    clientId: "$3"
    broker: "$4:$5"

# Generic per-second counters with 0-2 key/value pairs
- pattern: kafka.(\w+)<type=(.+), name=(.+)PerSec\w*, (.+)=(.+), (.+)=(.+)><>Count
  name: kafka_$1_$2_$3_total
  type: COUNTER
  labels:
    "$4": "$5"
    "$6": "$7"
- pattern: kafka.(\w+)<type=(.+), name=(.+)PerSec\w*, (.+)=(.+)><>Count
  name: kafka_$1_$2_$3_total
  type: COUNTER
  labels:
    "$4": "$5"
- pattern: kafka.(\w+)<type=(.+), name=(.+)PerSec\w*><>Count
  name: kafka_$1_$2_$3_total
  type: COUNTER

# Generic gauges with 0-2 key/value pairs
- pattern: kafka.(\w+)<type=(.+), name=(.+), (.+)=(.+), (.+)=(.+)><>Value
  name: kafka_$1_$2_$3
  type: GAUGE
  labels:
    "$4": "$5"
    "$6": "$7"
- pattern: kafka.(\w+)<type=(.+), name=(.+), (.+)=(.+)><>Value
  name: kafka_$1_$2_$3
  type: GAUGE
  labels:
    "$4": "$5"
- pattern: kafka.(\w+)<type=(.+), name=(.+)><>Value
  name: kafka_$1_$2_$3
  type: GAUGE

# Emulate Prometheus 'Summary' metrics for the exported 'Histogram's.
#
# Note that these are missing the '_sum' metric!
- pattern: kafka.(\w+)<type=(.+), name=(.+), (.+)=(.+), (.+)=(.+)><>Count
  name: kafka_$1_$2_$3_count
  type: COUNTER
  labels:
    "$4": "$5"
    "$6": "$7"
- pattern: kafka.(\w+)<type=(.+), name=(.+), (.+)=(.*), (.+)=(.+)><>(\d+)thPercentile
  name: kafka_$1_$2_$3
  type: GAUGE
  labels:
    "$4": "$5"
    "$6": "$7"
    quantile: "0.$8"
- pattern: kafka.(\w+)<type=(.+), name=(.+), (.+)=(.+)><>Count
  name: kafka_$1_$2_$3_count
  type: COUNTER
  labels:
    "$4": "$5"
- pattern: kafka.(\w+)<type=(.+), name=(.+), (.+)=(.*)><>(\d+)thPercentile
  name: kafka_$1_$2_$3
  type: GAUGE
  labels:
    "$4": "$5"
    quantile: "0.$6"
- pattern: kafka.(\w+)<type=(.+), name=(.+)><>Count
  name: kafka_$1_$2_$3_count
  type: COUNTER
- pattern: kafka.(\w+)<type=(.+), name=(.+)><>(\d+)thPercentile
  name: kafka_$1_$2_$3
  type: GAUGE
  labels:
    quantile: "0.$4"
5.重启kafka,验证jmx_exporter是否正常运行
systemctl restart kafka
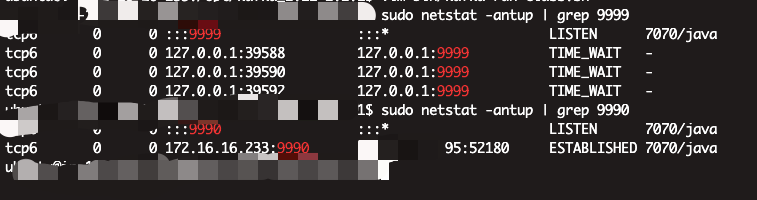
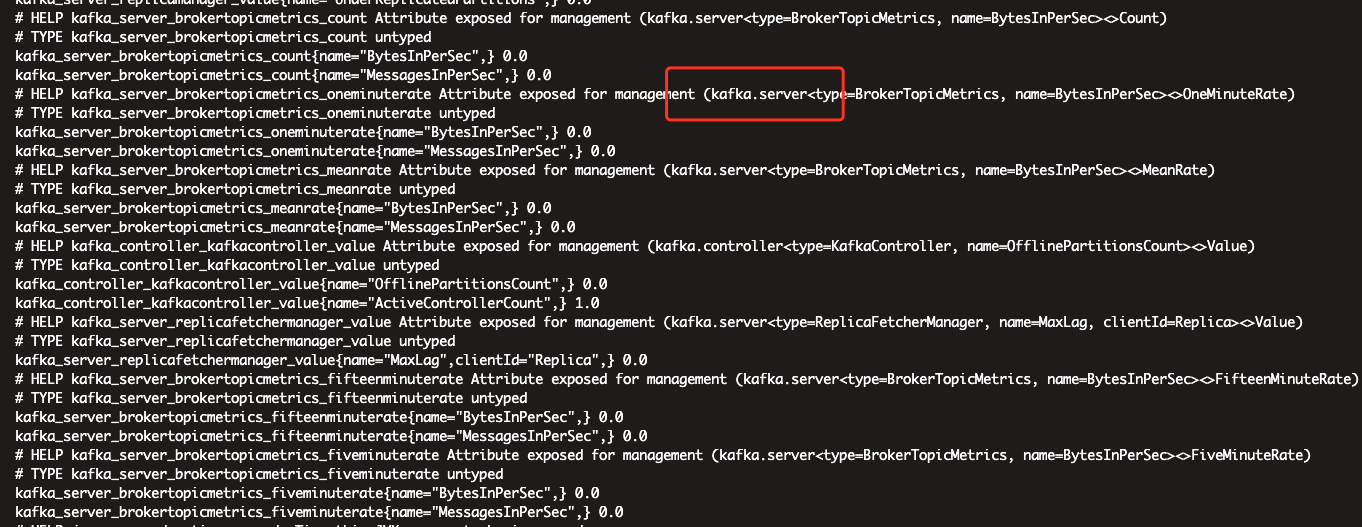
访问localhost:9990能够获取到数据就算可以了
6.prometheus-operator设置
- job_name: demo-kafka-jmx
        static_configs:
          - targets: ['127.0.0.1:9990']
            labels:
              app: "kafka-jmx"

kafka的prometheus的监控就完成了
7.grafana的模板文件
模板id:7589
{
  "annotations": {
    "list": [
      {
        "builtIn": 1,
        "datasource": "-- Grafana --",
        "enable": true,
        "hide": true,
        "iconColor": "rgba(0, 211, 255, 1)",
        "name": "Annotations & Alerts",
        "type": "dashboard"
      }
    ]
  },
  "description": "Kafka resource usage and throughput",
  "editable": true,
  "gnetId": 7589,
  "graphTooltip": 0,
  "id": 32,
  "iteration": 1639740219122,
  "links": [],
  "panels": [
    {
      "aliasColors": {},
      "bars": false,
      "dashLength": 10,
      "dashes": false,
      "datasource": "Prometheus",
      "fieldConfig": {
        "defaults": {
          "custom": {}
        },
        "overrides": []
      },
      "fill": 0,
      "fillGradient": 0,
      "gridPos": {
        "h": 10,
        "w": 10,
        "x": 0,
        "y": 0
      },
      "hiddenSeries": false,
      "id": 14,
      "legend": {
        "alignAsTable": true,
        "avg": false,
        "current": true,
        "max": true,
        "min": false,
        "rightSide": false,
        "show": true,
        "sideWidth": 480,
        "sort": "max",
        "sortDesc": true,
        "total": false,
        "values": true
      },
      "lines": true,
      "linewidth": 1,
      "links": [],
      "nullPointMode": "connected",
      "options": {
        "dataLinks": []
      },
      "percentage": false,
      "pointradius": 5,
      "points": false,
      "renderer": "flot",
      "seriesOverrides": [],
      "spaceLength": 10,
      "stack": false,
      "steppedLine": false,
      "targets": [
        {
          "expr": "sum(rate(kafka_topic_partition_current_offset{instance=\"$instance\", topic=~\"$topic\"}[1m])) by (topic)",
          "format": "time_series",
          "intervalFactor": 1,
          "legendFormat": "{{topic}}",
          "refId": "B"
        }
      ],
      "thresholds": [],
      "timeFrom": null,
      "timeRegions": [],
      "timeShift": null,
      "title": "Message in per second",
      "tooltip": {
        "shared": true,
        "sort": 0,
        "value_type": "individual"
      },
      "type": "graph",
      "xaxis": {
        "buckets": null,
        "mode": "time",
        "name": null,
        "show": true,
        "values": []
      },
      "yaxes": [
        {
          "format": "short",
          "label": null,
          "logBase": 1,
          "max": null,
          "min": "0",
          "show": true
        },
        {
          "format": "short",
          "label": null,
          "logBase": 1,
          "max": null,
          "min": null,
          "show": true
        }
      ],
      "yaxis": {
        "align": false,
        "alignLevel": null
      }
    },
    {
      "aliasColors": {},
      "bars": false,
      "dashLength": 10,
      "dashes": false,
      "datasource": "Prometheus",
      "fieldConfig": {
        "defaults": {
          "custom": {}
        },
        "overrides": []
      },
      "fill": 0,
      "fillGradient": 0,
      "gridPos": {
        "h": 10,
        "w": 10,
        "x": 10,
        "y": 0
      },
      "hiddenSeries": false,
      "id": 12,
      "legend": {
        "alignAsTable": true,
        "avg": false,
        "current": true,
        "max": true,
        "min": false,
        "rightSide": false,
        "show": true,
        "sideWidth": 480,
        "sortDesc": true,
        "total": false,
        "values": true
      },
      "lines": true,
      "linewidth": 1,
      "links": [],
      "nullPointMode": "connected",
      "options": {
        "dataLinks": []
      },
      "percentage": false,
      "pointradius": 5,
      "points": false,
      "renderer": "flot",
      "seriesOverrides": [],
      "spaceLength": 10,
      "stack": false,
      "steppedLine": false,
      "targets": [
        {
          "expr": "sum(kafka_consumergroup_lag{instance=\"$instance\",topic=~\"$topic\"}) by (consumergroup, topic) ",
          "format": "time_series",
          "instant": false,
          "interval": "",
          "intervalFactor": 1,
          "legendFormat": "{{consumergroup}} (topic: {{topic}})",
          "refId": "A"
        }
      ],
      "thresholds": [],
      "timeFrom": null,
      "timeRegions": [],
      "timeShift": null,
      "title": "Lag by  Consumer Group",
      "tooltip": {
        "shared": true,
        "sort": 2,
        "value_type": "individual"
      },
      "type": "graph",
      "xaxis": {
        "buckets": null,
        "mode": "time",
        "name": null,
        "show": true,
        "values": []
      },
      "yaxes": [
        {
          "format": "short",
          "label": "",
          "logBase": 1,
          "max": null,
          "min": "0",
          "show": true
        },
        {
          "format": "short",
          "label": null,
          "logBase": 1,
          "max": null,
          "min": null,
          "show": true
        }
      ],
      "yaxis": {
        "align": false,
        "alignLevel": null
      }
    },
    {
      "aliasColors": {},
      "bars": false,
      "dashLength": 10,
      "dashes": false,
      "datasource": "Prometheus",
      "fieldConfig": {
        "defaults": {
          "custom": {}
        },
        "overrides": []
      },
      "fill": 0,
      "fillGradient": 0,
      "gridPos": {
        "h": 10,
        "w": 10,
        "x": 0,
        "y": 10
      },
      "hiddenSeries": false,
      "id": 16,
      "legend": {
        "alignAsTable": true,
        "avg": false,
        "current": true,
        "max": true,
        "min": false,
        "rightSide": false,
        "show": true,
        "sideWidth": 480,
        "total": false,
        "values": true
      },
      "lines": true,
      "linewidth": 1,
      "links": [],
      "nullPointMode": "connected",
      "options": {
        "dataLinks": []
      },
      "percentage": false,
      "pointradius": 5,
      "points": false,
      "renderer": "flot",
      "seriesOverrides": [],
      "spaceLength": 10,
      "stack": false,
      "steppedLine": false,
      "targets": [
        {
          "expr": "sum(delta(kafka_topic_partition_current_offset{instance=~'$instance', topic=~\"$topic\"}[5m])/5) by (topic)",
          "format": "time_series",
          "intervalFactor": 1,
          "legendFormat": "{{topic}}",
          "refId": "A"
        }
      ],
      "thresholds": [],
      "timeFrom": null,
      "timeRegions": [],
      "timeShift": null,
      "title": "Message in per minute",
      "tooltip": {
        "shared": true,
        "sort": 0,
        "value_type": "individual"
      },
      "type": "graph",
      "xaxis": {
        "buckets": null,
        "mode": "time",
        "name": null,
        "show": true,
        "values": []
      },
      "yaxes": [
        {
          "format": "short",
          "label": null,
          "logBase": 1,
          "max": null,
          "min": null,
          "show": true
        },
        {
          "format": "short",
          "label": null,
          "logBase": 1,
          "max": null,
          "min": null,
          "show": true
        }
      ],
      "yaxis": {
        "align": false,
        "alignLevel": null
      }
    },
    {
      "aliasColors": {},
      "bars": false,
      "dashLength": 10,
      "dashes": false,
      "datasource": "Prometheus",
      "fieldConfig": {
        "defaults": {
          "custom": {}
        },
        "overrides": []
      },
      "fill": 0,
      "fillGradient": 0,
      "gridPos": {
        "h": 10,
        "w": 10,
        "x": 10,
        "y": 10
      },
      "hiddenSeries": false,
      "id": 18,
      "legend": {
        "alignAsTable": true,
        "avg": false,
        "current": true,
        "max": true,
        "min": false,
        "rightSide": false,
        "show": true,
        "sideWidth": 480,
        "sort": "current",
        "sortDesc": true,
        "total": false,
        "values": true
      },
      "lines": true,
      "linewidth": 1,
      "links": [],
      "nullPointMode": "connected",
      "options": {
        "dataLinks": []
      },
      "percentage": false,
      "pointradius": 5,
      "points": false,
      "renderer": "flot",
      "seriesOverrides": [],
      "spaceLength": 10,
      "stack": false,
      "steppedLine": false,
      "targets": [
        {
          "expr": "sum(delta(kafka_consumergroup_current_offset{instance=~'$instance',topic=~\"$topic\"}[5m])/5) by (consumergroup, topic)",
          "format": "time_series",
          "intervalFactor": 1,
          "legendFormat": "{{consumergroup}} (topic: {{topic}})",
          "refId": "A"
        }
      ],
      "thresholds": [],
      "timeFrom": null,
      "timeRegions": [],
      "timeShift": null,
      "title": "Message consume per minute",
      "tooltip": {
        "shared": true,
        "sort": 0,
        "value_type": "individual"
      },
      "type": "graph",
      "xaxis": {
        "buckets": null,
        "mode": "time",
        "name": null,
        "show": true,
        "values": []
      },
      "yaxes": [
        {
          "format": "short",
          "label": null,
          "logBase": 1,
          "max": null,
          "min": null,
          "show": true
        },
        {
          "format": "short",
          "label": null,
          "logBase": 1,
          "max": null,
          "min": null,
          "show": true
        }
      ],
      "yaxis": {
        "align": false,
        "alignLevel": null
      }
    },
    {
      "aliasColors": {},
      "bars": true,
      "dashLength": 10,
      "dashes": false,
      "datasource": "Prometheus",
      "fieldConfig": {
        "defaults": {
          "custom": {}
        },
        "overrides": []
      },
      "fill": 1,
      "fillGradient": 0,
      "gridPos": {
        "h": 7,
        "w": 20,
        "x": 0,
        "y": 20
      },
      "hiddenSeries": false,
      "id": 8,
      "legend": {
        "alignAsTable": true,
        "avg": false,
        "current": true,
        "max": false,
        "min": false,
        "rightSide": true,
        "show": true,
        "sideWidth": 420,
        "total": false,
        "values": true
      },
      "lines": false,
      "linewidth": 1,
      "links": [],
      "nullPointMode": "null",
      "options": {
        "dataLinks": []
      },
      "percentage": false,
      "pointradius": 5,
      "points": false,
      "renderer": "flot",
      "seriesOverrides": [],
      "spaceLength": 10,
      "stack": false,
      "steppedLine": false,
      "targets": [
        {
          "expr": "sum by(topic) (kafka_topic_partitions{instance=\"$instance\",topic=~\"$topic\"})",
          "format": "time_series",
          "intervalFactor": 1,
          "legendFormat": "{{topic}}",
          "refId": "A"
        }
      ],
      "thresholds": [],
      "timeFrom": null,
      "timeRegions": [],
      "timeShift": null,
      "title": "Partitions per Topic",
      "tooltip": {
        "shared": false,
        "sort": 0,
        "value_type": "individual"
      },
      "type": "graph",
      "xaxis": {
        "buckets": null,
        "mode": "series",
        "name": null,
        "show": false,
        "values": [
          "current"
        ]
      },
      "yaxes": [
        {
          "format": "short",
          "label": null,
          "logBase": 1,
          "max": null,
          "min": null,
          "show": true
        },
        {
          "format": "short",
          "label": null,
          "logBase": 1,
          "max": null,
          "min": null,
          "show": true
        }
      ],
      "yaxis": {
        "align": false,
        "alignLevel": null
      }
    }
  ],
  "refresh": false,
  "schemaVersion": 25,
  "style": "dark",
  "tags": [
    "Kafka"
  ],
  "templating": {
    "list": [
      {
        "allValue": null,
        "current": {
          "isNone": true,
          "selected": false,
          "text": "None",
          "value": ""
        },
        "datasource": "Prometheus",
        "definition": "",
        "hide": 0,
        "includeAll": false,
        "label": "Job",
        "multi": false,
        "name": "job",
        "options": [],
        "query": "label_values(kafka_consumergroup_current_offset, job)",
        "refresh": 1,
        "regex": "",
        "skipUrlSync": false,
        "sort": 0,
        "tagValuesQuery": "",
        "tags": [],
        "tagsQuery": "",
        "type": "query",
        "useTags": false
      },
      {
        "allValue": null,
        "current": {
          "isNone": true,
          "selected": false,
          "text": "None",
          "value": ""
        },
        "datasource": "Prometheus",
        "definition": "",
        "hide": 0,
        "includeAll": false,
        "label": "Instance",
        "multi": false,
        "name": "instance",
        "options": [],
        "query": "label_values(kafka_consumergroup_current_offset{job=~\"$job\"}, instance)",
        "refresh": 1,
        "regex": "",
        "skipUrlSync": false,
        "sort": 0,
        "tagValuesQuery": "",
        "tags": [],
        "tagsQuery": "",
        "type": "query",
        "useTags": false
      },
      {
        "allValue": null,
        "current": {
          "selected": false,
          "text": "All",
          "value": "$__all"
        },
        "datasource": "Prometheus",
        "definition": "",
        "hide": 0,
        "includeAll": true,
        "label": "Topic",
        "multi": true,
        "name": "topic",
        "options": [],
        "query": "label_values(kafka_topic_partition_current_offset{instance='$instance',topic!='__consumer_offsets',topic!='--kafka'}, topic)",
        "refresh": 1,
        "regex": "",
        "skipUrlSync": false,
        "sort": 1,
        "tagValuesQuery": "",
        "tags": [],
        "tagsQuery": "topic",
        "type": "query",
        "useTags": false
      }
    ]
  },
  "time": {
    "from": "now-24h",
    "to": "now"
  },
  "timepicker": {
    "refresh_intervals": [
      "10s",
      "30s",
      "1m",
      "5m",
      "15m",
      "30m",
      "1h",
      "2h",
      "1d"
    ],
    "time_options": [
      "5m",
      "15m",
      "1h",
      "6h",
      "12h",
      "24h",
      "2d",
      "7d",
      "30d"
    ]
  },
  "timezone": "browser",
  "title": "Kafka Exporter Overview",
  "uid": "jwPKIsniz",
  "version": 1
}
评论区