


前言:
现在都是使用K8S环境,所以集群内我们会使用prometheus-operator来快速部署prometheus,grafana,alertmanger三大件。下面演示一下如何通过oracle-exporter,mysql-exporter的方式添加oracle,mysql的数据库监控;
1.oracle-exporter,mysql-exporter的部署安装
部署文件已经放到个人码云上,只需要在values.yaml文件更改自己的数据库信息就可以完成部署了。
2.oracle-exporter,mysql-exporter部署完成后,需要在prometheus上添加配置信息;
如果exporter都部署完成了,需要在prometheus-operator的values.yaml文件添加以下配置信息:
additionalScrapeConfigs:
      - job_name: monitoring/oracle-export/0
        scrape_interval: 30s
        scrape_timeout: 10s
        metrics_path: /metrics
        scheme: http
        static_configs:
          - targets: ["oracle-export.monitoring:9161"]
      - job_name: monitoring/mysql-export/0
        scrape_interval: 30s
        scrape_timeout: 10s
        metrics_path: /metrics
        scheme: http
        static_configs:
          - targets: ["mysql-exporter-prometheus-mysql-exporter.monitoring:9104"]
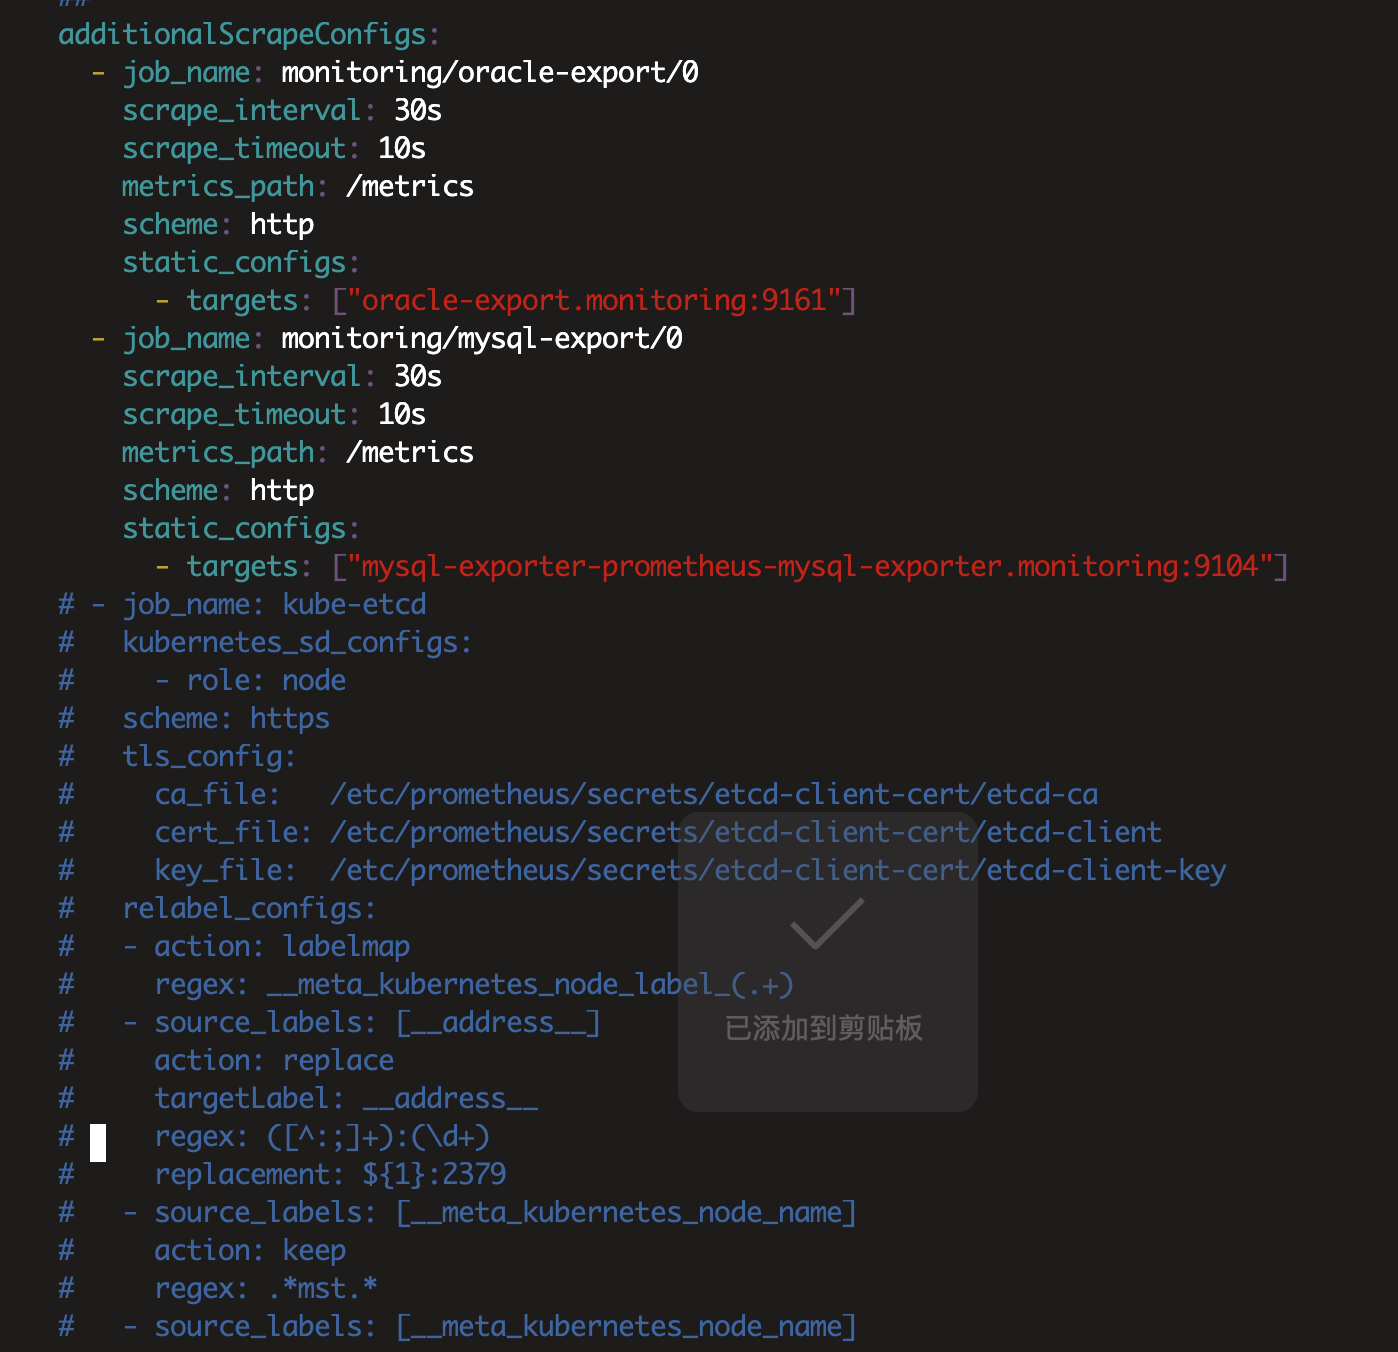
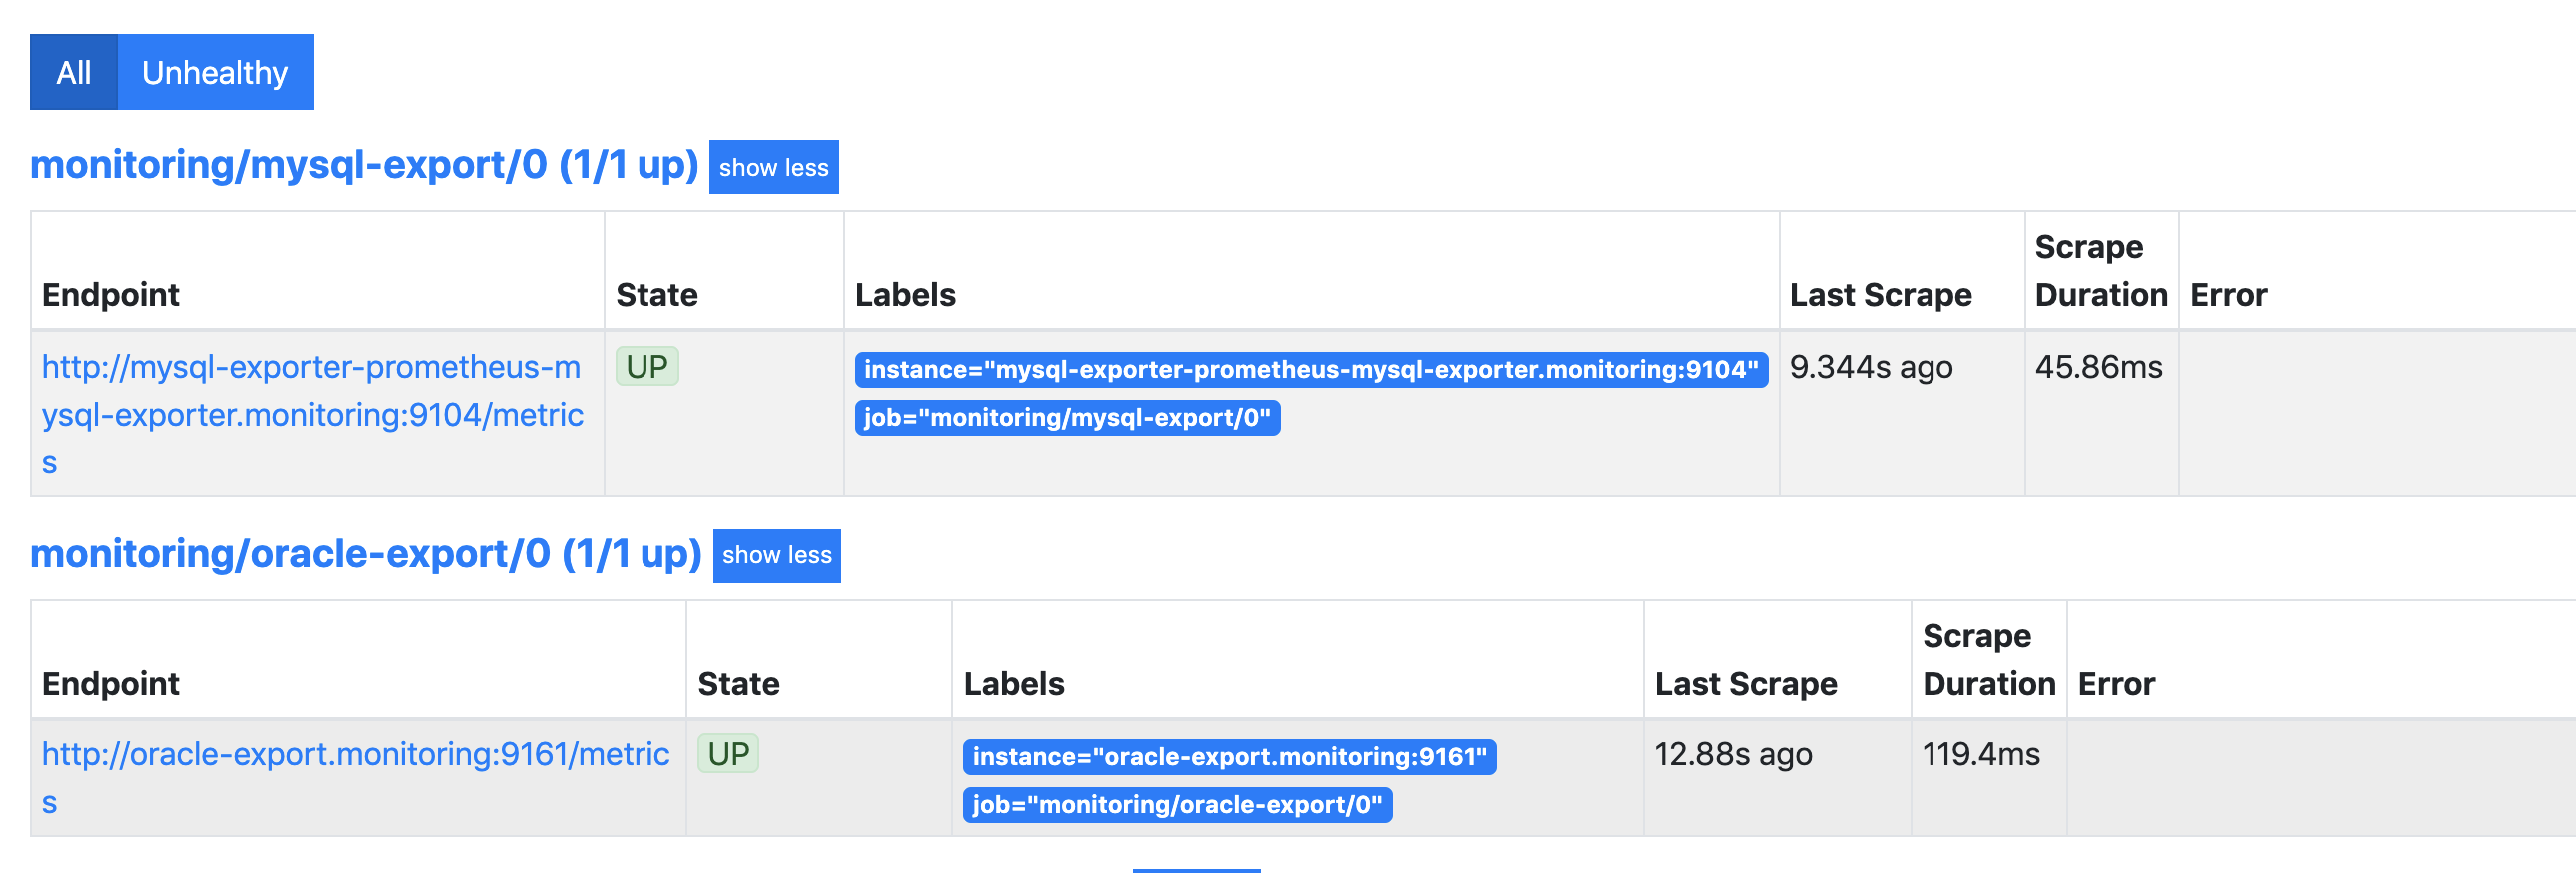
然后更新prometheus-operator然后就可以看到oracle和mysqld的监控信息了
3.添加oracle,mysql的grafana监控模板
oracle 监控模板
{
"annotations": {
"list": [
{
"builtIn": 1,
"datasource": "-- Grafana --",
"enable": true,
"hide": true,
"iconColor": "rgba(0, 211, 255, 1)",
"name": "Annotations & Alerts",
"type": "dashboard"
}
]
},
"description": "oracledb dashboard",
"editable": true,
"gnetId": 3333,
"graphTooltip": 1,
"id": 25,
"iteration": 1639576926060,
"links": [
{
"asDropdown": true,
"icon": "external link",
"includeVars": true,
"keepTime": true,
"tags": [
"host_all"
],
"title": "监控展示看板",
"type": "dashboards"
},
{
"asDropdown": true,
"icon": "external link",
"includeVars": true,
"keepTime": true,
"tags": [
"Atom"
],
"title": "Atomitl Service Status",
"type": "dashboards"
},
{
"asDropdown": true,
"icon": "external link",
"includeVars": true,
"keepTime": true,
"tags": [
"Ambassador"
],
"targetBlank": false,
"title": "Ambassador",
"type": "dashboards"
},
{
"asDropdown": true,
"icon": "external link",
"includeVars": true,
"keepTime": true,
"tags": [
"k8s"
],
"title": "Kubernetes",
"type": "dashboards"
},
{
"asDropdown": true,
"icon": "external link",
"includeVars": true,
"keepTime": true,
"tags": [
"redis"
],
"title": "redis",
"type": "dashboards"
},
{
"asDropdown": true,
"icon": "external link",
"includeVars": true,
"keepTime": true,
"tags": [
"kaka"
],
"title": "kaka",
"type": "dashboards"
},
{
"asDropdown": true,
"icon": "external link",
"includeVars": true,
"keepTime": true,
"tags": [
"mongodb"
],
"title": "mongodb",
"type": "dashboards"
},
{
"asDropdown": true,
"icon": "external link",
"includeVars": true,
"keepTime": true,
"tags": [
"mysqldb"
],
"title": "Mysql",
"type": "dashboards"
},
{
"asDropdown": true,
"icon": "external link",
"includeVars": true,
"keepTime": true,
"tags": [
"oracle"
],
"title": "oracle",
"type": "dashboards"
}
],
"panels": [
{
"collapsed": false,
"datasource": null,
"gridPos": {
"h": 1,
"w": 24,
"x": 0,
"y": 0
},
"id": 61,
"panels": [],
"repeat": null,
"title": "Widgets",
"type": "row"
},
{
"cacheTimeout": null,
"colorBackground": false,
"colorValue": true,
"colors": [
"rgba(245, 54, 54, 0.9)",
"rgba(237, 129, 40, 0.89)",
"rgba(50, 172, 45, 0.97)"
],
"datasource": "Prometheus",
"decimals": null,
"editable": true,
"error": false,
"fieldConfig": {
"defaults": {
"custom": {}
},
"overrides": []
},
"format": "none",
"gauge": {
"maxValue": 100,
"minValue": 0,
"show": false,
"thresholdLabels": false,
"thresholdMarkers": true
},
"gridPos": {
"h": 4,
"w": 6,
"x": 0,
"y": 1
},
"height": "125px",
"id": 12,
"interval": "$interval",
"links": [],
"mappingType": 1,
"mappingTypes": [
{
"name": "value to text",
"value": 1
},
{
"name": "range to text",
"value": 2
}
],
"maxDataPoints": 100,
"nullPointMode": "connected",
"nullText": null,
"postfix": "",
"postfixFontSize": "80%",
"prefix": "",
"prefixFontSize": "80%",
"rangeMaps": [
{
"from": "null",
"text": "N/A",
"to": "null"
}
],
"sparkline": {
"fillColor": "rgba(31, 118, 189, 0.18)",
"full": false,
"lineColor": "rgb(31, 120, 193)",
"show": false
},
"tableColumn": "oracledb_up{instance=\"oracle-export.monitoring:9161\", job=\"monitoring/oracle-export/0\"}",
"targets": [
{
"calculatedInterval": "10m",
"datasourceErrors": {},
"errors": {},
"expr": "oracledb_up{instance=\"$host\"}",
"format": "time_series",
"interval": "5m",
"intervalFactor": 1,
"legendFormat": "",
"metric": "",
"refId": "A",
"step": 300
}
],
"thresholds": "0,1",
"title": "oracledb status",
"type": "singlestat",
"valueFontSize": "100%",
"valueMaps": [
{
"op": "=",
"text": "DEAD",
"value": "0"
},
{
"op": "=",
"text": "ALIVE",
"value": "1"
}
],
"valueName": "current"
},
{
"cacheTimeout": null,
"datasource": "Prometheus",
"fieldConfig": {
"defaults": {
"color": {
"mode": "thresholds"
},
"custom": {},
"mappings": [],
"max": 100,
"min": 0,
"thresholds": {
"mode": "absolute",
"steps": [
{
"color": "green",
"index": 0,
"value": null
},
{
"color": "red",
"index": 1,
"value": 80
}
]
}
},
"overrides": []
},
"gridPos": {
"h": 4,
"w": 6,
"x": 6,
"y": 1
},
"id": 13,
"links": [],
"options": {
"orientation": "auto",
"reduceOptions": {
"calcs": [
"mean"
],
"fields": "",
"values": false
},
"showThresholdLabels": false,
"showThresholdMarkers": true
},
"pluginVersion": "7.0.3",
"targets": [
{
"calculatedInterval": "10m",
"datasourceErrors": {},
"errors": {},
"expr": "oracledb_sessions_active{instance=\"$host\"}",
"format": "time_series",
"interval": "$interval",
"intervalFactor": 1,
"legendFormat": "",
"metric": "",
"refId": "A",
"step": 60
}
],
"title": "active sessions",
"type": "gauge"
},
{
"cacheTimeout": null,
"colorBackground": false,
"colorValue": false,
"colors": [
"rgba(50, 172, 45, 0.97)",
"rgba(237, 129, 40, 0.89)",
"rgba(245, 54, 54, 0.9)"
],
"datasource": "Prometheus",
"decimals": null,
"editable": true,
"error": false,
"fieldConfig": {
"defaults": {
"custom": {}
},
"overrides": []
},
"format": "none",
"gauge": {
"maxValue": 100,
"minValue": 0,
"show": false,
"thresholdLabels": false,
"thresholdMarkers": true
},
"gridPos": {
"h": 4,
"w": 6,
"x": 12,
"y": 1
},
"height": "125px",
"id": 51,
"interval": "$interval",
"links": [],
"mappingType": 1,
"mappingTypes": [
{
"name": "value to text",
"value": 1
},
{
"name": "range to text",
"value": 2
}
],
"maxDataPoints": 100,
"nullPointMode": "connected",
"nullText": null,
"pluginVersion": "6.2.4",
"postfix": "",
"postfixFontSize": "50%",
"prefix": "",
"prefixFontSize": "80%",
"rangeMaps": [
{
"from": "null",
"text": "N/A",
"to": "null"
}
],
"sparkline": {
"fillColor": "rgba(31, 118, 189, 0.18)",
"full": false,
"lineColor": "rgb(31, 120, 193)",
"show": true
},
"tableColumn": "oracledb_activity_user_commits{instance=\"oracle-export.monitoring:9161\", job=\"monitoring/oracle-export/0\"}",
"targets": [
{
"calculatedInterval": "10m",
"datasourceErrors": {},
"errors": {},
"expr": "oracledb_activity_user_commits{instance=\"$host\"}",
"format": "time_series",
"interval": "5m",
"intervalFactor": 1,
"legendFormat": "",
"metric": "",
"refId": "A",
"step": 300
}
],
"thresholds": "90,95",
"title": "user commits",
"type": "singlestat",
"valueFontSize": "100%",
"valueMaps": [],
"valueName": "current"
},
{
"cacheTimeout": null,
"colorBackground": false,
"colorValue": true,
"colors": [
"rgba(245, 54, 54, 0.9)",
"rgba(237, 129, 40, 0.89)",
"rgba(50, 172, 45, 0.97)"
],
"datasource": "Prometheus",
"decimals": null,
"editable": true,
"error": false,
"fieldConfig": {
"defaults": {
"custom": {}
},
"overrides": []
},
"format": "none",
"gauge": {
"maxValue": 100,
"minValue": 0,
"show": false,
"thresholdLabels": false,
"thresholdMarkers": true
},
"gridPos": {
"h": 4,
"w": 6,
"x": 18,
"y": 1
},
"height": "125px",
"id": 52,
"interval": "$interval",
"links": [],
"mappingType": 1,
"mappingTypes": [
{
"name": "value to text",
"value": 1
},
{
"name": "range to text",
"value": 2
}
],
"maxDataPoints": 100,
"nullPointMode": "connected",
"nullText": null,
"postfix": "",
"postfixFontSize": "50%",
"prefix": "",
"prefixFontSize": "80%",
"rangeMaps": [
{
"from": "null",
"text": "N/A",
"to": "null"
}
],
"repeat": null,
"sparkline": {
"fillColor": "rgba(31, 118, 189, 0.18)",
"full": false,
"lineColor": "rgb(31, 120, 193)",
"show": true
},
"tableColumn": "oracledb_activity_execute_count{instance=\"oracle-export.monitoring:9161\", job=\"monitoring/oracle-export/0\"}",
"targets": [
{
"calculatedInterval": "10m",
"datasourceErrors": {},
"errors": {},
"expr": "oracledb_activity_execute_count{instance=\"$host\"}",
"format": "time_series",
"interval": "5m",
"intervalFactor": 1,
"legendFormat": "",
"metric": "",
"refId": "A",
"step": 300
}
],
"thresholds": "",
"title": "execute count",
"type": "singlestat",
"valueFontSize": "100%",
"valueMaps": [],
"valueName": "current"
},
{
"collapsed": true,
"datasource": null,
"gridPos": {
"h": 1,
"w": 24,
"x": 0,
"y": 5
},
"id": 62,
"panels": [
{
"aliasColors": {},
"bars": false,
"dashLength": 10,
"dashes": false,
"datasource": "Prometheus",
"fill": 1,
"gridPos": {
"h": 7,
"w": 12,
"x": 0,
"y": 6
},
"id": 57,
"legend": {
"avg": false,
"current": false,
"max": false,
"min": false,
"show": false,
"total": false,
"values": false
},
"lines": true,
"linewidth": 2,
"links": [],
"nullPointMode": "null",
"options": {},
"percentage": false,
"pointradius": 5,
"points": false,
"renderer": "flot",
"seriesOverrides": [],
"spaceLength": 10,
"stack": false,
"steppedLine": false,
"targets": [
{
"expr": "oracledb_exporter_last_scrape_duration_seconds{instance=\"$host\"}\t",
"format": "time_series",
"intervalFactor": 2,
"refId": "A",
"step": 10
}
],
"thresholds": [],
"timeFrom": null,
"timeRegions": [],
"timeShift": null,
"title": "last scrape duration seconds",
"tooltip": {
"shared": true,
"sort": 0,
"value_type": "individual"
},
"type": "graph",
"xaxis": {
"buckets": null,
"mode": "time",
"name": null,
"show": true,
"values": []
},
"yaxes": [
{
"format": "short",
"label": null,
"logBase": 1,
"max": null,
"min": null,
"show": true
},
{
"format": "short",
"label": null,
"logBase": 1,
"max": null,
"min": null,
"show": true
}
],
"yaxis": {
"align": false,
"alignLevel": null
}
},
{
"aliasColors": {},
"bars": false,
"dashLength": 10,
"dashes": false,
"datasource": "Prometheus",
"fill": 1,
"gridPos": {
"h": 7,
"w": 12,
"x": 12,
"y": 6
},
"id": 58,
"legend": {
"avg": false,
"current": false,
"max": false,
"min": false,
"show": false,
"total": false,
"values": false
},
"lines": true,
"linewidth": 2,
"links": [],
"nullPointMode": "null",
"options": {},
"percentage": false,
"pointradius": 5,
"points": false,
"renderer": "flot",
"seriesOverrides": [],
"spaceLength": 10,
"stack": false,
"steppedLine": false,
"targets": [
{
"expr": "oracledb_exporter_scrapes_total{instance=\"$host\"}",
"format": "time_series",
"intervalFactor": 2,
"refId": "A",
"step": 10
}
],
"thresholds": [],
"timeFrom": null,
"timeRegions": [],
"timeShift": null,
"title": "total scrapes",
"tooltip": {
"shared": true,
"sort": 0,
"value_type": "individual"
},
"type": "graph",
"xaxis": {
"buckets": null,
"mode": "time",
"name": null,
"show": true,
"values": []
},
"yaxes": [
{
"format": "short",
"label": null,
"logBase": 1,
"max": null,
"min": null,
"show": true
},
{
"format": "short",
"label": null,
"logBase": 1,
"max": null,
"min": null,
"show": true
}
],
"yaxis": {
"align": false,
"alignLevel": null
}
}
],
"repeat": null,
"title": "Exporter Status",
"type": "row"
},
{
"collapsed": false,
"datasource": null,
"gridPos": {
"h": 1,
"w": 24,
"x": 0,
"y": 6
},
"id": 63,
"panels": [],
"repeat": null,
"title": "Table Locks",
"type": "row"
},
{
"aliasColors": {},
"bars": false,
"dashLength": 10,
"dashes": false,
"datasource": "Prometheus",
"decimals": null,
"editable": true,
"error": false,
"fieldConfig": {
"defaults": {
"custom": {}
},
"overrides": []
},
"fill": 2,
"fillGradient": 0,
"grid": {},
"gridPos": {
"h": 7,
"w": 8,
"x": 0,
"y": 7
},
"hiddenSeries": false,
"id": 53,
"legend": {
"alignAsTable": false,
"avg": false,
"current": false,
"max": false,
"min": false,
"rightSide": false,
"show": false,
"total": false,
"values": false
},
"lines": true,
"linewidth": 2,
"links": [],
"nullPointMode": "null",
"options": {
"dataLinks": []
},
"percentage": false,
"pointradius": 5,
"points": false,
"renderer": "flot",
"seriesOverrides": [],
"spaceLength": 10,
"stack": false,
"steppedLine": false,
"targets": [
{
"calculatedInterval": "2m",
"datasourceErrors": {},
"errors": {},
"expr": "oracledb_wait_time_concurrency{instance=\"$host\"}",
"format": "time_series",
"interval": "$interval",
"intervalFactor": 1,
"legendFormat": "",
"metric": "",
"refId": "A",
"step": 60
}
],
"thresholds": [],
"timeFrom": null,
"timeRegions": [],
"timeShift": null,
"title": "wait time concurrency",
"tooltip": {
"msResolution": false,
"shared": true,
"sort": 0,
"value_type": "individual"
},
"type": "graph",
"xaxis": {
"buckets": null,
"mode": "time",
"name": null,
"show": true,
"values": []
},
"yaxes": [
{
"format": "short",
"logBase": 1,
"max": null,
"min": 0,
"show": true
},
{
"format": "short",
"logBase": 1,
"max": null,
"min": 0,
"show": true
}
],
"yaxis": {
"align": false,
"alignLevel": null
}
},
{
"aliasColors": {},
"bars": false,
"dashLength": 10,
"dashes": false,
"datasource": "Prometheus",
"decimals": null,
"editable": true,
"error": false,
"fieldConfig": {
"defaults": {
"custom": {}
},
"overrides": []
},
"fill": 2,
"fillGradient": 0,
"grid": {},
"gridPos": {
"h": 7,
"w": 9,
"x": 8,
"y": 7
},
"hiddenSeries": false,
"id": 54,
"legend": {
"alignAsTable": false,
"avg": false,
"current": false,
"max": false,
"min": false,
"rightSide": false,
"show": false,
"total": false,
"values": false
},
"lines": true,
"linewidth": 2,
"links": [],
"nullPointMode": "null",
"options": {
"dataLinks": []
},
"percentage": false,
"pointradius": 5,
"points": false,
"renderer": "flot",
"seriesOverrides": [],
"spaceLength": 10,
"stack": false,
"steppedLine": false,
"targets": [
{
"calculatedInterval": "2m",
"datasourceErrors": {},
"errors": {},
"expr": "oracledb_wait_time_commit{instance=\"$host\"}",
"format": "time_series",
"interval": "$interval",
"intervalFactor": 1,
"legendFormat": "",
"metric": "",
"refId": "A",
"step": 60
}
],
"thresholds": [],
"timeFrom": null,
"timeRegions": [],
"timeShift": null,
"title": "wait time commit",
"tooltip": {
"msResolution": false,
"shared": true,
"sort": 0,
"value_type": "individual"
},
"type": "graph",
"xaxis": {
"buckets": null,
"mode": "time",
"name": null,
"show": true,
"values": []
},
"yaxes": [
{
"format": "short",
"logBase": 1,
"max": null,
"min": 0,
"show": true
},
{
"format": "short",
"logBase": 1,
"max": null,
"min": 0,
"show": true
}
],
"yaxis": {
"align": false,
"alignLevel": null
}
},
{
"aliasColors": {},
"bars": false,
"dashLength": 10,
"dashes": false,
"datasource": "Prometheus",
"decimals": null,
"editable": true,
"error": false,
"fieldConfig": {
"defaults": {
"custom": {}
},
"overrides": []
},
"fill": 2,
"fillGradient": 0,
"grid": {},
"gridPos": {
"h": 7,
"w": 7,
"x": 17,
"y": 7
},
"hiddenSeries": false,
"id": 55,
"legend": {
"alignAsTable": false,
"avg": false,
"current": false,
"max": false,
"min": false,
"rightSide": false,
"show": false,
"total": false,
"values": false
},
"lines": true,
"linewidth": 2,
"links": [],
"nullPointMode": "null",
"options": {
"dataLinks": []
},
"percentage": false,
"pointradius": 5,
"points": false,
"renderer": "flot",
"seriesOverrides": [],
"spaceLength": 10,
"stack": false,
"steppedLine": false,
"targets": [
{
"calculatedInterval": "2m",
"datasourceErrors": {},
"errors": {},
"expr": "oracledb_wait_time_system_io{instance=\"$host\"}",
"format": "time_series",
"interval": "$interval",
"intervalFactor": 1,
"legendFormat": "",
"metric": "",
"refId": "A",
"step": 60
}
],
"thresholds": [],
"timeFrom": null,
"timeRegions": [],
"timeShift": null,
"title": "wait time system io",
"tooltip": {
"msResolution": false,
"shared": true,
"sort": 0,
"value_type": "individual"
},
"type": "graph",
"xaxis": {
"buckets": null,
"mode": "time",
"name": null,
"show": true,
"values": []
},
"yaxes": [
{
"format": "short",
"logBase": 1,
"max": null,
"min": 0,
"show": true
},
{
"format": "short",
"logBase": 1,
"max": null,
"min": 0,
"show": true
}
],
"yaxis": {
"align": false,
"alignLevel": null
}
},
{
"aliasColors": {},
"bars": false,
"dashLength": 10,
"dashes": false,
"datasource": "Prometheus",
"decimals": null,
"editable": true,
"error": false,
"fieldConfig": {
"defaults": {
"custom": {}
},
"overrides": []
},
"fill": 2,
"fillGradient": 0,
"grid": {},
"gridPos": {
"h": 6,
"w": 8,
"x": 0,
"y": 14
},
"hiddenSeries": false,
"id": 59,
"legend": {
"alignAsTable": false,
"avg": false,
"current": false,
"max": false,
"min": false,
"rightSide": false,
"show": false,
"total": false,
"values": false
},
"lines": true,
"linewidth": 2,
"links": [],
"nullPointMode": "null",
"options": {
"dataLinks": []
},
"percentage": false,
"pointradius": 5,
"points": false,
"renderer": "flot",
"seriesOverrides": [],
"spaceLength": 10,
"stack": false,
"steppedLine": false,
"targets": [
{
"calculatedInterval": "2m",
"datasourceErrors": {},
"errors": {},
"expr": "oracledb_wait_time_application{instance=\"$host\"}\t",
"format": "time_series",
"interval": "$interval",
"intervalFactor": 1,
"legendFormat": "",
"metric": "",
"refId": "A",
"step": 60
}
],
"thresholds": [],
"timeFrom": null,
"timeRegions": [],
"timeShift": null,
"title": "wait time application",
"tooltip": {
"msResolution": false,
"shared": true,
"sort": 0,
"value_type": "individual"
},
"type": "graph",
"xaxis": {
"buckets": null,
"mode": "time",
"name": null,
"show": true,
"values": []
},
"yaxes": [
{
"format": "short",
"logBase": 1,
"max": null,
"min": 0,
"show": true
},
{
"format": "short",
"logBase": 1,
"max": null,
"min": 0,
"show": true
}
],
"yaxis": {
"align": false,
"alignLevel": null
}
},
{
"aliasColors": {},
"bars": false,
"dashLength": 10,
"dashes": false,
"datasource": "Prometheus",
"decimals": null,
"editable": true,
"error": false,
"fieldConfig": {
"defaults": {
"custom": {}
},
"overrides": []
},
"fill": 2,
"fillGradient": 0,
"grid": {},
"gridPos": {
"h": 6,
"w": 9,
"x": 8,
"y": 14
},
"hiddenSeries": false,
"id": 56,
"legend": {
"alignAsTable": false,
"avg": false,
"current": false,
"max": false,
"min": false,
"rightSide": false,
"show": false,
"total": false,
"values": false
},
"lines": true,
"linewidth": 2,
"links": [],
"nullPointMode": "null",
"options": {
"dataLinks": []
},
"percentage": false,
"pointradius": 5,
"points": false,
"renderer": "flot",
"seriesOverrides": [],
"spaceLength": 10,
"stack": false,
"steppedLine": false,
"targets": [
{
"calculatedInterval": "2m",
"datasourceErrors": {},
"errors": {},
"expr": "oracledb_wait_time_user_io{instance=\"$host\"}\t",
"format": "time_series",
"interval": "$interval",
"intervalFactor": 1,
"legendFormat": "",
"metric": "",
"refId": "A",
"step": 60
}
],
"thresholds": [],
"timeFrom": null,
"timeRegions": [],
"timeShift": null,
"title": "wait time user io",
"tooltip": {
"msResolution": false,
"shared": true,
"sort": 0,
"value_type": "individual"
},
"type": "graph",
"xaxis": {
"buckets": null,
"mode": "time",
"name": null,
"show": true,
"values": []
},
"yaxes": [
{
"format": "short",
"logBase": 1,
"max": null,
"min": 0,
"show": true
},
{
"format": "short",
"logBase": 1,
"max": null,
"min": 0,
"show": true
}
],
"yaxis": {
"align": false,
"alignLevel": null
}
},
{
"aliasColors": {},
"bars": false,
"dashLength": 10,
"dashes": false,
"datasource": "Prometheus",
"decimals": null,
"editable": true,
"error": false,
"fieldConfig": {
"defaults": {
"custom": {}
},
"overrides": []
},
"fill": 2,
"fillGradient": 0,
"grid": {},
"gridPos": {
"h": 6,
"w": 7,
"x": 17,
"y": 14
},
"hiddenSeries": false,
"id": 60,
"legend": {
"alignAsTable": false,
"avg": false,
"current": false,
"max": false,
"min": false,
"rightSide": false,
"show": false,
"total": false,
"values": false
},
"lines": true,
"linewidth": 2,
"links": [],
"nullPointMode": "null",
"options": {
"dataLinks": []
},
"percentage": false,
"pointradius": 5,
"points": false,
"renderer": "flot",
"seriesOverrides": [],
"spaceLength": 10,
"stack": false,
"steppedLine": false,
"targets": [
{
"calculatedInterval": "2m",
"datasourceErrors": {},
"errors": {},
"expr": "oracledb_wait_time_network{instance=\"$host\"}\t",
"format": "time_series",
"interval": "$interval",
"intervalFactor": 1,
"legendFormat": "",
"metric": "",
"refId": "A",
"step": 60
}
],
"thresholds": [],
"timeFrom": null,
"timeRegions": [],
"timeShift": null,
"title": "wait time network",
"tooltip": {
"msResolution": false,
"shared": true,
"sort": 0,
"value_type": "individual"
},
"type": "graph",
"xaxis": {
"buckets": null,
"mode": "time",
"name": null,
"show": true,
"values": []
},
"yaxes": [
{
"format": "short",
"logBase": 1,
"max": null,
"min": 0,
"show": true
},
{
"format": "short",
"logBase": 1,
"max": null,
"min": 0,
"show": true
}
],
"yaxis": {
"align": false,
"alignLevel": null
}
},
{
"collapsed": true,
"datasource": null,
"gridPos": {
"h": 1,
"w": 24,
"x": 0,
"y": 20
},
"id": 68,
"panels": [
{
"aliasColors": {},
"bars": false,
"dashLength": 10,
"dashes": false,
"fill": 1,
"gridPos": {
"h": 8,
"w": 12,
"x": 0,
"y": 21
},
"id": 65,
"legend": {
"alignAsTable": true,
"avg": false,
"current": true,
"max": false,
"min": false,
"rightSide": true,
"show": true,
"total": false,
"values": true
},
"lines": true,
"linewidth": 2,
"links": [],
"nullPointMode": "null",
"options": {},
"percentage": false,
"pointradius": 2,
"points": false,
"renderer": "flot",
"seriesOverrides": [],
"spaceLength": 10,
"stack": false,
"steppedLine": false,
"targets": [
{
"expr": "oracledb_tablespace_bytes{instance=\"$host\"}",
"format": "time_series",
"intervalFactor": 1,
"legendFormat": "{{tablespace}}",
"refId": "A"
}
],
"thresholds": [],
"timeFrom": null,
"timeRegions": [],
"timeShift": null,
"title": "已使用表空间",
"tooltip": {
"shared": true,
"sort": 0,
"value_type": "individual"
},
"type": "graph",
"xaxis": {
"buckets": null,
"mode": "time",
"name": null,
"show": true,
"values": []
},
"yaxes": [
{
"format": "bytes",
"label": null,
"logBase": 1,
"max": null,
"min": null,
"show": true
},
{
"format": "short",
"label": null,
"logBase": 1,
"max": null,
"min": null,
"show": true
}
],
"yaxis": {
"align": false,
"alignLevel": null
}
},
{
"aliasColors": {},
"bars": false,
"dashLength": 10,
"dashes": false,
"fill": 1,
"gridPos": {
"h": 8,
"w": 12,
"x": 12,
"y": 21
},
"id": 66,
"legend": {
"alignAsTable": true,
"avg": false,
"current": true,
"max": false,
"min": false,
"rightSide": true,
"show": true,
"total": false,
"values": true
},
"lines": true,
"linewidth": 2,
"links": [],
"nullPointMode": "null",
"options": {},
"percentage": false,
"pointradius": 2,
"points": false,
"renderer": "flot",
"seriesOverrides": [],
"spaceLength": 10,
"stack": false,
"steppedLine": false,
"targets": [
{
"expr": "oracledb_sessions_active{instance=\"$host\"}",
"format": "time_series",
"intervalFactor": 1,
"legendFormat": "active",
"refId": "A"
},
{
"expr": "oracledb_sessions_activity{instance=\"$host\"}",
"format": "time_series",
"intervalFactor": 1,
"legendFormat": "activity:{{type}}",
"refId": "B"
},
{
"expr": "oracledb_sessions_inactive{instance=\"$host\"}",
"format": "time_series",
"intervalFactor": 1,
"legendFormat": "inactive",
"refId": "C"
}
],
"thresholds": [],
"timeFrom": null,
"timeRegions": [],
"timeShift": null,
"title": "状态会话统计",
"tooltip": {
"shared": true,
"sort": 0,
"value_type": "individual"
},
"type": "graph",
"xaxis": {
"buckets": null,
"mode": "time",
"name": null,
"show": true,
"values": []
},
"yaxes": [
{
"format": "none",
"label": null,
"logBase": 1,
"max": null,
"min": null,
"show": true
},
{
"format": "none",
"label": null,
"logBase": 1,
"max": null,
"min": null,
"show": true
}
],
"yaxis": {
"align": false,
"alignLevel": null
}
},
{
"aliasColors": {},
"bars": false,
"dashLength": 10,
"dashes": false,
"fill": 1,
"gridPos": {
"h": 8,
"w": 12,
"x": 0,
"y": 29
},
"id": 70,
"legend": {
"alignAsTable": true,
"avg": false,
"current": true,
"max": false,
"min": false,
"rightSide": true,
"show": true,
"total": false,
"values": true
},
"lines": true,
"linewidth": 2,
"links": [],
"nullPointMode": "null",
"options": {},
"percentage": false,
"pointradius": 2,
"points": false,
"renderer": "flot",
"seriesOverrides": [],
"spaceLength": 10,
"stack": false,
"steppedLine": false,
"targets": [
{
"expr": "oracledb_tablespace_max_bytes{instance=\"$host\"}",
"format": "time_series",
"intervalFactor": 1,
"legendFormat": "{{tablespace}}",
"refId": "A"
}
],
"thresholds": [],
"timeFrom": null,
"timeRegions": [],
"timeShift": null,
"title": "可使用表空间",
"tooltip": {
"shared": true,
"sort": 0,
"value_type": "individual"
},
"type": "graph",
"xaxis": {
"buckets": null,
"mode": "time",
"name": null,
"show": true,
"values": []
},
"yaxes": [
{
"format": "bits",
"label": null,
"logBase": 1,
"max": null,
"min": null,
"show": true
},
{
"format": "short",
"label": null,
"logBase": 1,
"max": null,
"min": null,
"show": true
}
],
"yaxis": {
"align": false,
"alignLevel": null
}
},
{
"aliasColors": {},
"bars": false,
"dashLength": 10,
"dashes": false,
"fill": 1,
"gridPos": {
"h": 8,
"w": 12,
"x": 12,
"y": 29
},
"id": 69,
"legend": {
"alignAsTable": true,
"avg": false,
"current": true,
"max": false,
"min": false,
"rightSide": true,
"show": true,
"total": false,
"values": true
},
"lines": true,
"linewidth": 2,
"links": [],
"nullPointMode": "null",
"options": {},
"percentage": false,
"pointradius": 2,
"points": false,
"renderer": "flot",
"seriesOverrides": [],
"spaceLength": 10,
"stack": false,
"steppedLine": false,
"targets": [
{
"expr": "oracledb_process_count{instance=\"$host\"}",
"format": "time_series",
"intervalFactor": 1,
"legendFormat": "process",
"refId": "A"
}
],
"thresholds": [],
"timeFrom": null,
"timeRegions": [],
"timeShift": null,
"title": "Oracle process",
"tooltip": {
"shared": true,
"sort": 0,
"value_type": "individual"
},
"type": "graph",
"xaxis": {
"buckets": null,
"mode": "time",
"name": null,
"show": true,
"values": []
},
"yaxes": [
{
"format": "none",
"label": null,
"logBase": 1,
"max": null,
"min": null,
"show": true
},
{
"format": "none",
"label": null,
"logBase": 1,
"max": null,
"min": null,
"show": true
}
],
"yaxis": {
"align": false,
"alignLevel": null
}
}
],
"title": "Row title",
"type": "row"
}
],
"refresh": false,
"schemaVersion": 25,
"style": "dark",
"tags": [
"oracle"
],
"templating": {
"list": [
{
"allFormat": "glob",
"allValue": null,
"current": {
"selected": false,
"text": "oracle-export.monitoring:9161",
"value": "oracle-export.monitoring:9161"
},
"datasource": "Prometheus",
"definition": "",
"hide": 0,
"includeAll": false,
"label": "",
"multi": false,
"multiFormat": "regex values",
"name": "host",
"options": [],
"query": "label_values(oracledb_up, instance)",
"refresh": 1,
"refresh_on_load": false,
"regex": "",
"skipUrlSync": false,
"sort": 1,
"tagValuesQuery": null,
"tags": [],
"tagsQuery": null,
"type": "query",
"useTags": false
},
{
"allFormat": "glob",
"auto": true,
"auto_count": 200,
"auto_min": "1s",
"current": {
"selected": false,
"text": "1m",
"value": "1m"
},
"datasource": "Prometheus",
"hide": 0,
"includeAll": false,
"label": "Interval",
"multi": false,
"multiFormat": "glob",
"name": "interval",
"options": [
{
"selected": false,
"text": "auto",
"value": "$__auto_interval_interval"
},
{
"selected": false,
"text": "1s",
"value": "1s"
},
{
"selected": false,
"text": "5s",
"value": "5s"
},
{
"selected": true,
"text": "1m",
"value": "1m"
},
{
"selected": false,
"text": "5m",
"value": "5m"
},
{
"selected": false,
"text": "1h",
"value": "1h"
},
{
"selected": false,
"text": "6h",
"value": "6h"
},
{
"selected": false,
"text": "1d",
"value": "1d"
}
],
"query": "1s,5s,1m,5m,1h,6h,1d",
"refresh": 2,
"skipUrlSync": false,
"type": "interval"
}
]
},
"time": {
"from": "now-15m",
"to": "now"
},
"timepicker": {
"collapse": false,
"enable": true,
"notice": false,
"now": true,
"refresh_intervals": [
"10s",
"30s",
"1m",
"5m",
"15m",
"30m",
"1h",
"2h",
"1d"
],
"status": "Stable",
"time_options": [
"5m",
"15m",
"1h",
"6h",
"12h",
"24h",
"2d",
"7d",
"30d"
],
"type": "timepicker"
},
"timezone": "browser",
"title": "Oracle Overview",
"uid": "p9U4fs7Wk",
"version": 1
}
mysql监控模板
{
"annotations": {
"list": [
{
"builtIn": 1,
"datasource": "-- Grafana --",
"enable": true,
"hide": false,
"iconColor": "#e0752d",
"limit": 100,
"name": "PMM Annotations",
"showIn": 0,
"tags": [
"pmm_annotation"
],
"type": "tags"
},
{
"builtIn": 1,
"datasource": "-- Grafana --",
"enable": true,
"hide": true,
"iconColor": "#6ed0e0",
"limit": 100,
"name": "Annotations & Alerts",
"showIn": 0,
"tags": [],
"type": "dashboard"
}
]
},
"editable": true,
"gnetId": null,
"graphTooltip": 1,
"id": 28,
"iteration": 1639577040795,
"links": [
{
"asDropdown": true,
"icon": "external link",
"includeVars": true,
"keepTime": true,
"tags": [
"host_all"
],
"title": "监控展示看板",
"type": "dashboards"
},
{
"asDropdown": true,
"icon": "external link",
"includeVars": true,
"keepTime": true,
"tags": [
"Atomitl Service Status"
],
"title": "Atomitl Service Status",
"type": "dashboards"
},
{
"asDropdown": true,
"icon": "external link",
"includeVars": true,
"keepTime": true,
"tags": [
"Ambassador"
],
"title": "Ambassador",
"type": "dashboards"
},
{
"asDropdown": true,
"icon": "external link",
"includeVars": true,
"keepTime": true,
"tags": [
" k8s"
],
"title": "Kubernetes",
"type": "dashboards"
},
{
"asDropdown": true,
"icon": "external link",
"includeVars": true,
"keepTime": true,
"tags": [
"redis"
],
"title": "redis",
"type": "dashboards"
},
{
"asDropdown": true,
"icon": "external link",
"includeVars": true,
"keepTime": true,
"tags": [
"kaka"
],
"title": "kaka",
"type": "dashboards"
},
{
"asDropdown": true,
"icon": "external link",
"includeVars": true,
"keepTime": true,
"tags": [
"mongodb"
],
"title": "mongodb",
"type": "dashboards"
},
{
"asDropdown": true,
"icon": "external link",
"includeVars": true,
"keepTime": true,
"tags": [
"mysqldb"
],
"title": "Mysql",
"type": "dashboards"
},
{
"asDropdown": true,
"icon": "external link",
"includeVars": true,
"keepTime": true,
"tags": [
"oracle"
],
"title": "oracle",
"type": "dashboards"
}
],
"panels": [
{
"collapsed": false,
"datasource": null,
"gridPos": {
"h": 1,
"w": 24,
"x": 0,
"y": 0
},
"id": 382,
"panels": [],
"repeat": null,
"title": "",
"type": "row"
},
{
"cacheTimeout": null,
"colorBackground": false,
"colorValue": true,
"colors": [
"rgba(245, 54, 54, 0.9)",
"rgba(237, 129, 40, 0.89)",
"rgba(50, 172, 45, 0.97)"
],
"datasource": "Prometheus",
"decimals": 1,
"description": "**MySQL Uptime**\n\nThe amount of time since the last restart of the MySQL server process.",
"editable": true,
"error": false,
"fieldConfig": {
"defaults": {
"custom": {}
},
"overrides": []
},
"format": "s",
"gauge": {
"maxValue": 100,
"minValue": 0,
"show": false,
"thresholdLabels": false,
"thresholdMarkers": true
},
"gridPos": {
"h": 2,
"w": 6,
"x": 0,
"y": 1
},
"height": "125px",
"id": 12,
"interval": "$interval",
"links": [],
"mappingType": 1,
"mappingTypes": [
{
"name": "value to text",
"value": 1
},
{
"name": "range to text",
"value": 2
}
],
"maxDataPoints": 100,
"nullPointMode": "connected",
"nullText": null,
"postfix": "s",
"postfixFontSize": "80%",
"prefix": "",
"prefixFontSize": "80%",
"rangeMaps": [
{
"from": "null",
"text": "N/A",
"to": "null"
}
],
"sparkline": {
"fillColor": "rgba(31, 118, 189, 0.18)",
"full": false,
"lineColor": "rgb(31, 120, 193)",
"show": false
},
"tableColumn": "mysql_global_status_uptime{instance=\"mysql-exporter-prometheus-mysql-exporter.monitoring:9104\", job=\"monitoring/mysql-export/0\"}",
"targets": [
{
"calculatedInterval": "10m",
"datasourceErrors": {},
"errors": {},
"expr": "mysql_global_status_uptime{instance=\"$host\"}",
"format": "time_series",
"interval": "5m",
"intervalFactor": 1,
"legendFormat": "",
"metric": "",
"refId": "A",
"step": 300
}
],
"thresholds": "300,3600",
"title": "MySQL Uptime",
"type": "singlestat",
"valueFontSize": "80%",
"valueMaps": [],
"valueName": "current"
},
{
"cacheTimeout": null,
"colorBackground": false,
"colorValue": false,
"colors": [
"rgba(245, 54, 54, 0.9)",
"rgba(237, 129, 40, 0.89)",
"rgba(50, 172, 45, 0.97)"
],
"datasource": "Prometheus",
"decimals": 2,
"description": "**Current QPS**\n\nBased on the queries reported by MySQL's ``SHOW STATUS`` command, it is the number of statements executed by the server within the last second. This variable includes statements executed within stored programs, unlike the Questions variable. It does not count \n``COM_PING`` or ``COM_STATISTICS`` commands.",
"editable": true,
"error": false,
"fieldConfig": {
"defaults": {
"custom": {}
},
"overrides": []
},
"format": "short",
"gauge": {
"maxValue": 100,
"minValue": 0,
"show": false,
"thresholdLabels": false,
"thresholdMarkers": true
},
"gridPos": {
"h": 2,
"w": 6,
"x": 6,
"y": 1
},
"height": "125px",
"id": 13,
"interval": "$interval",
"links": [
{
"targetBlank": true,
"title": "MySQL Server Status Variables",
"url": "https://dev.mysql.com/doc/refman/5.7/en/server-status-variables.html#statvar_Queries"
}
],
"mappingType": 1,
"mappingTypes": [
{
"name": "value to text",
"value": 1
},
{
"name": "range to text",
"value": 2
}
],
"maxDataPoints": 100,
"nullPointMode": "connected",
"nullText": null,
"postfix": "",
"postfixFontSize": "50%",
"prefix": "",
"prefixFontSize": "80%",
"rangeMaps": [
{
"from": "null",
"text": "N/A",
"to": "null"
}
],
"sparkline": {
"fillColor": "rgba(31, 118, 189, 0.18)",
"full": false,
"lineColor": "rgb(31, 120, 193)",
"show": true
},
"tableColumn": "{instance=\"mysql-exporter-prometheus-mysql-exporter.monitoring:9104\", job=\"monitoring/mysql-export/0\"}",
"targets": [
{
"calculatedInterval": "10m",
"datasourceErrors": {},
"errors": {},
"expr": "rate(mysql_global_status_queries{instance=\"$host\"}[$interval]) or irate(mysql_global_status_queries{instance=\"$host\"}[5m])",
"format": "time_series",
"interval": "$interval",
"intervalFactor": 1,
"legendFormat": "",
"metric": "",
"refId": "A",
"step": 20
}
],
"thresholds": "35,75",
"title": "Current QPS",
"type": "singlestat",
"valueFontSize": "80%",
"valueMaps": [],
"valueName": "current"
},
{
"cacheTimeout": null,
"colorBackground": false,
"colorValue": false,
"colors": [
"rgba(50, 172, 45, 0.97)",
"rgba(237, 129, 40, 0.89)",
"rgba(245, 54, 54, 0.9)"
],
"datasource": "Prometheus",
"decimals": 0,
"description": "**InnoDB Buffer Pool Size**\n\nInnoDB maintains a storage area called the buffer pool for caching data and indexes in memory. Knowing how the InnoDB buffer pool works, and taking advantage of it to keep frequently accessed data in memory, is one of the most important aspects of MySQL tuning. The goal is to keep the working set in memory. In most cases, this should be between 60%-90% of available memory on a dedicated database host, but depends on many factors.",
"editable": true,
"error": false,
"fieldConfig": {
"defaults": {
"custom": {}
},
"overrides": []
},
"format": "bytes",
"gauge": {
"maxValue": 100,
"minValue": 0,
"show": false,
"thresholdLabels": false,
"thresholdMarkers": true
},
"gridPos": {
"h": 2,
"w": 6,
"x": 12,
"y": 1
},
"height": "125px",
"id": 51,
"interval": "$interval",
"links": [
{
"targetBlank": true,
"title": "Tuning the InnoDB Buffer Pool Size",
"url": "https://www.percona.com/blog/2015/06/02/80-ram-tune-innodb_buffer_pool_size/"
}
],
"mappingType": 1,
"mappingTypes": [
{
"name": "value to text",
"value": 1
},
{
"name": "range to text",
"value": 2
}
],
"maxDataPoints": 100,
"nullPointMode": "connected",
"nullText": null,
"postfix": "",
"postfixFontSize": "50%",
"prefix": "",
"prefixFontSize": "80%",
"rangeMaps": [
{
"from": "null",
"text": "N/A",
"to": "null"
}
],
"sparkline": {
"fillColor": "rgba(31, 118, 189, 0.18)",
"full": false,
"lineColor": "rgb(31, 120, 193)",
"show": false
},
"tableColumn": "mysql_global_variables_innodb_buffer_pool_size{instance=\"mysql-exporter-prometheus-mysql-exporter.monitoring:9104\", job=\"monitoring/mysql-export/0\"}",
"targets": [
{
"calculatedInterval": "10m",
"datasourceErrors": {},
"errors": {},
"expr": "mysql_global_variables_innodb_buffer_pool_size{instance=\"$host\"}",
"format": "time_series",
"interval": "5m",
"intervalFactor": 1,
"legendFormat": "",
"metric": "",
"refId": "A",
"step": 300
}
],
"thresholds": "90,95",
"title": "InnoDB Buffer Pool Size",
"type": "singlestat",
"valueFontSize": "80%",
"valueMaps": [],
"valueName": "current"
},
{
"cacheTimeout": null,
"colorBackground": false,
"colorValue": false,
"colors": [
"#299c46",
"rgba(237, 129, 40, 0.89)",
"#d44a3a"
],
"datasource": "Prometheus",
"description": "**InnoDB Buffer Pool Size % of Total RAM**\n\nInnoDB maintains a storage area called the buffer pool for caching data and indexes in memory. Knowing how the InnoDB buffer pool works, and taking advantage of it to keep frequently accessed data in memory, is one of the most important aspects of MySQL tuning. The goal is to keep the working set in memory. In most cases, this should be between 60%-90% of available memory on a dedicated database host, but depends on many factors.",
"fieldConfig": {
"defaults": {
"custom": {}
},
"overrides": []
},
"format": "none",
"gauge": {
"maxValue": 100,
"minValue": 0,
"show": false,
"thresholdLabels": false,
"thresholdMarkers": true
},
"gridPos": {
"h": 2,
"w": 6,
"x": 18,
"y": 1
},
"id": 52,
"interval": null,
"links": [
{
"targetBlank": true,
"title": "Tuning the InnoDB Buffer Pool Size",
"url": "https://www.percona.com/blog/2015/06/02/80-ram-tune-innodb_buffer_pool_size/"
}
],
"mappingType": 1,
"mappingTypes": [
{
"name": "value to text",
"value": 1
},
{
"name": "range to text",
"value": 2
}
],
"maxDataPoints": 100,
"nullPointMode": "connected",
"nullText": null,
"postfix": "",
"postfixFontSize": "50%",
"prefix": "",
"prefixFontSize": "50%",
"rangeMaps": [
{
"from": "null",
"text": "N/A",
"to": "null"
}
],
"repeat": null,
"sparkline": {
"fillColor": "rgba(31, 118, 189, 0.18)",
"full": false,
"lineColor": "rgb(31, 120, 193)",
"show": false
},
"tableColumn": "",
"targets": [
{
"calculatedInterval": "10m",
"datasourceErrors": {},
"errors": {},
"expr": "(mysql_global_variables_innodb_buffer_pool_size{instance=\"$host\"} * 100) / on (instance) node_memory_MemTotal{instance=\"$host\"}",
"format": "time_series",
"interval": "5m",
"intervalFactor": 1,
"legendFormat": "",
"metric": "",
"refId": "A",
"step": 300
}
],
"thresholds": "",
"title": "Buffer Pool Size of Total RAM",
"type": "singlestat",
"valueFontSize": "80%",
"valueMaps": [
{
"op": "=",
"text": "N/A",
"value": "null"
}
],
"valueName": "avg"
},
{
"collapsed": false,
"datasource": null,
"gridPos": {
"h": 1,
"w": 24,
"x": 0,
"y": 3
},
"id": 383,
"panels": [],
"repeat": null,
"title": "Connections",
"type": "row"
},
{
"aliasColors": {},
"bars": false,
"dashLength": 10,
"dashes": false,
"datasource": "Prometheus",
"decimals": 0,
"description": "**Max Connections** \n\nMax Connections is the maximum permitted number of simultaneous client connections. By default, this is 151. Increasing this value increases the number of file descriptors that mysqld requires. If the required number of descriptors are not available, the server reduces the value of Max Connections.\n\nmysqld actually permits Max Connections + 1 clients to connect. The extra connection is reserved for use by accounts that have the SUPER privilege, such as root.\n\nMax Used Connections is the maximum number of connections that have been in use simultaneously since the server started.\n\nConnections is the number of connection attempts (successful or not) to the MySQL server.",
"editable": true,
"error": false,
"fieldConfig": {
"defaults": {
"custom": {}
},
"overrides": []
},
"fill": 2,
"fillGradient": 0,
"grid": {},
"gridPos": {
"h": 7,
"w": 12,
"x": 0,
"y": 4
},
"height": "250px",
"hiddenSeries": false,
"id": 92,
"legend": {
"alignAsTable": true,
"avg": true,
"current": false,
"max": true,
"min": true,
"show": true,
"sort": "avg",
"sortDesc": true,
"total": false,
"values": true
},
"lines": true,
"linewidth": 2,
"links": [
{
"targetBlank": true,
"title": "MySQL Server System Variables",
"url": "https://dev.mysql.com/doc/refman/5.7/en/server-system-variables.html#sysvar_max_connections"
}
],
"nullPointMode": "null",
"options": {
"dataLinks": []
},
"paceLength": 10,
"percentage": false,
"pointradius": 5,
"points": false,
"renderer": "flot",
"seriesOverrides": [
{
"alias": "Max Connections",
"fill": 0
}
],
"spaceLength": 10,
"stack": false,
"steppedLine": false,
"targets": [
{
"calculatedInterval": "2m",
"datasourceErrors": {},
"errors": {},
"expr": "max(max_over_time(mysql_global_status_threads_connected{instance=\"$host\"}[$interval]) or mysql_global_status_threads_connected{instance=\"$host\"} )",
"format": "time_series",
"interval": "$interval",
"intervalFactor": 1,
"legendFormat": "Connections",
"metric": "",
"refId": "A",
"step": 20
},
{
"calculatedInterval": "2m",
"datasourceErrors": {},
"errors": {},
"expr": "mysql_global_status_max_used_connections{instance=\"$host\"}",
"format": "time_series",
"interval": "$interval",
"intervalFactor": 1,
"legendFormat": "Max Used Connections",
"metric": "",
"refId": "C",
"step": 20,
"target": ""
},
{
"calculatedInterval": "2m",
"datasourceErrors": {},
"errors": {},
"expr": "mysql_global_variables_max_connections{instance=\"$host\"}",
"format": "time_series",
"interval": "$interval",
"intervalFactor": 1,
"legendFormat": "Max Connections",
"metric": "",
"refId": "B",
"step": 20,
"target": ""
}
],
"thresholds": [],
"timeFrom": null,
"timeRegions": [],
"timeShift": null,
"title": "MySQL Connections",
"tooltip": {
"msResolution": false,
"shared": true,
"sort": 0,
"value_type": "cumulative"
},
"type": "graph",
"xaxis": {
"buckets": null,
"mode": "time",
"name": null,
"show": true,
"values": []
},
"yaxes": [
{
"format": "short",
"label": "",
"logBase": 1,
"max": null,
"min": 0,
"show": true
},
{
"format": "short",
"label": "",
"logBase": 1,
"max": null,
"min": 0,
"show": true
}
],
"yaxis": {
"align": false,
"alignLevel": null
}
},
{
"aliasColors": {},
"bars": false,
"dashLength": 10,
"dashes": false,
"datasource": "Prometheus",
"decimals": 2,
"description": "**MySQL Active Threads**\n\nThreads Connected is the number of open connections, while Threads Running is the number of threads not sleeping.",
"editable": true,
"error": false,
"fieldConfig": {
"defaults": {
"custom": {}
},
"overrides": []
},
"fill": 2,
"fillGradient": 0,
"grid": {},
"gridPos": {
"h": 7,
"w": 12,
"x": 12,
"y": 4
},
"hiddenSeries": false,
"id": 10,
"legend": {
"alignAsTable": true,
"avg": true,
"current": false,
"max": true,
"min": true,
"rightSide": false,
"show": true,
"sort": "avg",
"sortDesc": true,
"total": false,
"values": true
},
"lines": true,
"linewidth": 2,
"links": [],
"nullPointMode": "null",
"options": {
"dataLinks": []
},
"paceLength": 10,
"percentage": false,
"pointradius": 5,
"points": false,
"renderer": "flot",
"seriesOverrides": [
{
"alias": "Peak Threads Running",
"color": "#E24D42",
"lines": false,
"pointradius": 1,
"points": true
},
{
"alias": "Peak Threads Connected",
"color": "#1F78C1"
},
{
"alias": "Avg Threads Running",
"color": "#EAB839"
}
],
"spaceLength": 10,
"stack": false,
"steppedLine": false,
"targets": [
{
"calculatedInterval": "2m",
"datasourceErrors": {},
"errors": {},
"expr": "max_over_time(mysql_global_status_threads_connected{instance=\"$host\"}[$interval]) or\nmax_over_time(mysql_global_status_threads_connected{instance=\"$host\"}[5m])",
"format": "time_series",
"hide": false,
"interval": "$interval",
"intervalFactor": 1,
"legendFormat": "Peak Threads Connected",
"metric": "",
"refId": "A",
"step": 20
},
{
"calculatedInterval": "2m",
"datasourceErrors": {},
"errors": {},
"expr": "max_over_time(mysql_global_status_threads_running{instance=\"$host\"}[$interval]) or\nmax_over_time(mysql_global_status_threads_running{instance=\"$host\"}[5m])",
"format": "time_series",
"interval": "$interval",
"intervalFactor": 1,
"legendFormat": "Peak Threads Running",
"metric": "",
"refId": "B",
"step": 20
},
{
"expr": "avg_over_time(mysql_global_status_threads_running{instance=\"$host\"}[$interval]) or \navg_over_time(mysql_global_status_threads_running{instance=\"$host\"}[5m])",
"format": "time_series",
"interval": "$interval",
"intervalFactor": 1,
"legendFormat": "Avg Threads Running",
"refId": "C",
"step": 20
}
],
"thresholds": [],
"timeFrom": null,
"timeRegions": [],
"timeShift": null,
"title": "MySQL Client Thread Activity",
"tooltip": {
"msResolution": false,
"shared": true,
"sort": 0,
"value_type": "individual"
},
"type": "graph",
"xaxis": {
"buckets": null,
"mode": "time",
"name": null,
"show": true,
"values": [
"total"
]
},
"yaxes": [
{
"format": "short",
"label": "Threads",
"logBase": 1,
"max": null,
"min": 0,
"show": true
},
{
"format": "short",
"label": "",
"logBase": 1,
"max": null,
"min": 0,
"show": false
}
],
"yaxis": {
"align": false,
"alignLevel": null
}
},
{
"collapsed": false,
"datasource": null,
"gridPos": {
"h": 1,
"w": 24,
"x": 0,
"y": 11
},
"id": 384,
"panels": [],
"repeat": null,
"title": "Table Locks",
"type": "row"
},
{
"aliasColors": {},
"bars": false,
"dashLength": 10,
"dashes": false,
"datasource": "Prometheus",
"decimals": 2,
"description": "**MySQL Questions**\n\nThe number of statements executed by the server. This includes only statements sent to the server by clients and not statements executed within stored programs, unlike the Queries used in the QPS calculation. \n\nThis variable does not count the following commands:\n* ``COM_PING``\n* ``COM_STATISTICS``\n* ``COM_STMT_PREPARE``\n* ``COM_STMT_CLOSE``\n* ``COM_STMT_RESET``",
"editable": true,
"error": false,
"fieldConfig": {
"defaults": {
"custom": {}
},
"overrides": []
},
"fill": 2,
"fillGradient": 0,
"grid": {},
"gridPos": {
"h": 7,
"w": 12,
"x": 0,
"y": 12
},
"hiddenSeries": false,
"id": 53,
"legend": {
"alignAsTable": true,
"avg": true,
"current": false,
"max": true,
"min": true,
"rightSide": false,
"show": true,
"sort": "avg",
"sortDesc": true,
"total": false,
"values": true
},
"lines": true,
"linewidth": 2,
"links": [
{
"targetBlank": true,
"title": "MySQL Queries and Questions",
"url": "https://www.percona.com/blog/2014/05/29/how-mysql-queries-and-questions-are-measured/"
}
],
"nullPointMode": "null",
"options": {
"dataLinks": []
},
"paceLength": 10,
"percentage": false,
"pointradius": 5,
"points": false,
"renderer": "flot",
"seriesOverrides": [],
"spaceLength": 10,
"stack": false,
"steppedLine": false,
"targets": [
{
"calculatedInterval": "2m",
"datasourceErrors": {},
"errors": {},
"expr": "rate(mysql_global_status_questions{instance=\"$host\"}[$interval]) or irate(mysql_global_status_questions{instance=\"$host\"}[5m])",
"format": "time_series",
"interval": "$interval",
"intervalFactor": 1,
"legendFormat": "Questions",
"metric": "",
"refId": "A",
"step": 20
}
],
"thresholds": [],
"timeFrom": null,
"timeRegions": [],
"timeShift": null,
"title": "MySQL Questions",
"tooltip": {
"msResolution": false,
"shared": true,
"sort": 0,
"value_type": "individual"
},
"type": "graph",
"xaxis": {
"buckets": null,
"mode": "time",
"name": null,
"show": true,
"values": []
},
"yaxes": [
{
"format": "short",
"logBase": 1,
"max": null,
"min": 0,
"show": true
},
{
"format": "short",
"logBase": 1,
"max": null,
"min": 0,
"show": true
}
],
"yaxis": {
"align": false,
"alignLevel": null
}
},
{
"aliasColors": {},
"bars": false,
"dashLength": 10,
"dashes": false,
"datasource": "Prometheus",
"decimals": 2,
"description": "**MySQL Thread Cache**\n\nThe thread_cache_size variable sets how many threads the server should cache to reuse. When a client disconnects, the client's threads are put in the cache if the cache is not full. It is autosized in MySQL 5.6.8 and above (capped to 100). Requests for threads are satisfied by reusing threads taken from the cache if possible, and only when the cache is empty is a new thread created.\n\n* *Threads_created*: The number of threads created to handle connections.\n* *Threads_cached*: The number of threads in the thread cache.",
"editable": true,
"error": false,
"fieldConfig": {
"defaults": {
"custom": {}
},
"overrides": []
},
"fill": 2,
"fillGradient": 0,
"grid": {},
"gridPos": {
"h": 7,
"w": 12,
"x": 12,
"y": 12
},
"hiddenSeries": false,
"id": 11,
"legend": {
"alignAsTable": true,
"avg": true,
"current": false,
"max": true,
"min": true,
"rightSide": false,
"show": true,
"sort": "avg",
"sortDesc": true,
"total": false,
"values": true
},
"lines": true,
"linewidth": 2,
"links": [
{
"title": "Tuning information",
"url": "https://dev.mysql.com/doc/refman/5.6/en/server-system-variables.html#sysvar_thread_cache_size"
}
],
"nullPointMode": "null",
"options": {
"dataLinks": []
},
"paceLength": 10,
"percentage": false,
"pointradius": 5,
"points": false,
"renderer": "flot",
"seriesOverrides": [
{
"alias": "Threads Created",
"fill": 0
}
],
"spaceLength": 10,
"stack": false,
"steppedLine": false,
"targets": [
{
"calculatedInterval": "2m",
"datasourceErrors": {},
"errors": {},
"expr": "mysql_global_variables_thread_cache_size{instance=\"$host\"}",
"format": "time_series",
"interval": "$interval",
"intervalFactor": 1,
"legendFormat": "Thread Cache Size",
"metric": "",
"refId": "B",
"step": 20
},
{
"calculatedInterval": "2m",
"datasourceErrors": {},
"errors": {},
"expr": "mysql_global_status_threads_cached{instance=\"$host\"}",
"format": "time_series",
"interval": "$interval",
"intervalFactor": 1,
"legendFormat": "Threads Cached",
"metric": "",
"refId": "C",
"step": 20
},
{
"calculatedInterval": "2m",
"datasourceErrors": {},
"errors": {},
"expr": "rate(mysql_global_status_threads_created{instance=\"$host\"}[$interval]) or irate(mysql_global_status_threads_created{instance=\"$host\"}[5m])",
"format": "time_series",
"interval": "$interval",
"intervalFactor": 1,
"legendFormat": "Threads Created",
"metric": "",
"refId": "A",
"step": 20
}
],
"thresholds": [],
"timeFrom": null,
"timeRegions": [],
"timeShift": null,
"title": "MySQL Thread Cache",
"tooltip": {
"msResolution": false,
"shared": true,
"sort": 0,
"value_type": "individual"
},
"type": "graph",
"xaxis": {
"buckets": null,
"mode": "time",
"name": null,
"show": true,
"values": []
},
"yaxes": [
{
"format": "short",
"logBase": 1,
"max": null,
"min": 0,
"show": true
},
{
"format": "short",
"logBase": 1,
"max": null,
"min": 0,
"show": true
}
],
"yaxis": {
"align": false,
"alignLevel": null
}
},
{
"collapsed": false,
"datasource": null,
"gridPos": {
"h": 1,
"w": 24,
"x": 0,
"y": 19
},
"id": 385,
"panels": [],
"repeat": null,
"title": "Temporary Objects",
"type": "row"
},
{
"aliasColors": {},
"bars": false,
"dashLength": 10,
"dashes": false,
"datasource": "Prometheus",
"decimals": 2,
"editable": true,
"error": false,
"fieldConfig": {
"defaults": {
"custom": {}
},
"overrides": []
},
"fill": 2,
"fillGradient": 0,
"grid": {},
"gridPos": {
"h": 7,
"w": 12,
"x": 0,
"y": 20
},
"hiddenSeries": false,
"id": 22,
"legend": {
"alignAsTable": true,
"avg": true,
"current": false,
"max": true,
"min": true,
"rightSide": false,
"show": true,
"sort": "avg",
"sortDesc": true,
"total": false,
"values": true
},
"lines": true,
"linewidth": 2,
"links": [],
"nullPointMode": "null",
"options": {
"dataLinks": []
},
"paceLength": 10,
"percentage": false,
"pointradius": 5,
"points": false,
"renderer": "flot",
"seriesOverrides": [],
"spaceLength": 10,
"stack": false,
"steppedLine": false,
"targets": [
{
"calculatedInterval": "2m",
"datasourceErrors": {},
"errors": {},
"expr": "rate(mysql_global_status_created_tmp_tables{instance=\"$host\"}[$interval]) or irate(mysql_global_status_created_tmp_tables{instance=\"$host\"}[5m])",
"interval": "$interval",
"intervalFactor": 1,
"legendFormat": "Created Tmp Tables",
"metric": "",
"refId": "A",
"step": 20
},
{
"calculatedInterval": "2m",
"datasourceErrors": {},
"errors": {},
"expr": "rate(mysql_global_status_created_tmp_disk_tables{instance=\"$host\"}[$interval]) or irate(mysql_global_status_created_tmp_disk_tables{instance=\"$host\"}[5m])",
"interval": "$interval",
"intervalFactor": 1,
"legendFormat": "Created Tmp Disk Tables",
"metric": "",
"refId": "B",
"step": 20
},
{
"calculatedInterval": "2m",
"datasourceErrors": {},
"errors": {},
"expr": "rate(mysql_global_status_created_tmp_files{instance=\"$host\"}[$interval]) or irate(mysql_global_status_created_tmp_files{instance=\"$host\"}[5m])",
"interval": "$interval",
"intervalFactor": 1,
"legendFormat": "Created Tmp Files",
"metric": "",
"refId": "C",
"step": 20
}
],
"thresholds": [],
"timeFrom": null,
"timeRegions": [],
"timeShift": null,
"title": "MySQL Temporary Objects",
"tooltip": {
"msResolution": false,
"shared": true,
"sort": 0,
"value_type": "individual"
},
"type": "graph",
"xaxis": {
"buckets": null,
"mode": "time",
"name": null,
"show": true,
"values": []
},
"yaxes": [
{
"format": "short",
"logBase": 1,
"max": null,
"min": 0,
"show": true
},
{
"format": "short",
"logBase": 1,
"max": null,
"min": 0,
"show": true
}
],
"yaxis": {
"align": false,
"alignLevel": null
}
},
{
"aliasColors": {},
"bars": false,
"dashLength": 10,
"dashes": false,
"datasource": "Prometheus",
"decimals": 2,
"description": "**MySQL Select Types**\n\nAs with most relational databases, selecting based on indexes is more efficient than scanning an entire table's data. Here we see the counters for selects not done with indexes.\n\n* ***Select Scan*** is how many queries caused full table scans, in which all the data in the table had to be read and either discarded or returned.\n* ***Select Range*** is how many queries used a range scan, which means MySQL scanned all rows in a given range.\n* ***Select Full Join*** is the number of joins that are not joined on an index, this is usually a huge performance hit.",
"editable": true,
"error": false,
"fieldConfig": {
"defaults": {
"custom": {}
},
"overrides": []
},
"fill": 2,
"fillGradient": 0,
"grid": {},
"gridPos": {
"h": 7,
"w": 12,
"x": 12,
"y": 20
},
"height": "250px",
"hiddenSeries": false,
"id": 311,
"legend": {
"alignAsTable": true,
"avg": true,
"current": false,
"hideZero": true,
"max": true,
"min": true,
"rightSide": false,
"show": true,
"sort": "avg",
"sortDesc": true,
"total": false,
"values": true
},
"lines": true,
"linewidth": 2,
"links": [],
"nullPointMode": "null",
"options": {
"dataLinks": []
},
"paceLength": 10,
"percentage": false,
"pointradius": 5,
"points": false,
"renderer": "flot",
"seriesOverrides": [],
"spaceLength": 10,
"stack": false,
"steppedLine": false,
"targets": [
{
"calculatedInterval": "2m",
"datasourceErrors": {},
"errors": {},
"expr": "rate(mysql_global_status_select_full_join{instance=\"$host\"}[$interval]) or irate(mysql_global_status_select_full_join{instance=\"$host\"}[5m])",
"format": "time_series",
"interval": "$interval",
"intervalFactor": 1,
"legendFormat": "Select Full Join",
"metric": "",
"refId": "A",
"step": 20
},
{
"calculatedInterval": "2m",
"datasourceErrors": {},
"errors": {},
"expr": "rate(mysql_global_status_select_full_range_join{instance=\"$host\"}[$interval]) or irate(mysql_global_status_select_full_range_join{instance=\"$host\"}[5m])",
"format": "time_series",
"interval": "$interval",
"intervalFactor": 1,
"legendFormat": "Select Full Range Join",
"metric": "",
"refId": "B",
"step": 20
},
{
"calculatedInterval": "2m",
"datasourceErrors": {},
"errors": {},
"expr": "rate(mysql_global_status_select_range{instance=\"$host\"}[$interval]) or irate(mysql_global_status_select_range{instance=\"$host\"}[5m])",
"format": "time_series",
"interval": "$interval",
"intervalFactor": 1,
"legendFormat": "Select Range",
"metric": "",
"refId": "C",
"step": 20
},
{
"calculatedInterval": "2m",
"datasourceErrors": {},
"errors": {},
"expr": "rate(mysql_global_status_select_range_check{instance=\"$host\"}[$interval]) or irate(mysql_global_status_select_range_check{instance=\"$host\"}[5m])",
"format": "time_series",
"interval": "$interval",
"intervalFactor": 1,
"legendFormat": "Select Range Check",
"metric": "",
"refId": "D",
"step": 20
},
{
"calculatedInterval": "2m",
"datasourceErrors": {},
"errors": {},
"expr": "rate(mysql_global_status_select_scan{instance=\"$host\"}[$interval]) or irate(mysql_global_status_select_scan{instance=\"$host\"}[5m])",
"format": "time_series",
"interval": "$interval",
"intervalFactor": 1,
"legendFormat": "Select Scan",
"metric": "",
"refId": "E",
"step": 20
}
],
"thresholds": [],
"timeFrom": null,
"timeRegions": [],
"timeShift": null,
"title": "MySQL Select Types",
"tooltip": {
"msResolution": false,
"shared": true,
"sort": 0,
"value_type": "individual"
},
"type": "graph",
"xaxis": {
"buckets": null,
"mode": "time",
"name": null,
"show": true,
"values": []
},
"yaxes": [
{
"format": "short",
"logBase": 1,
"max": null,
"min": 0,
"show": true
},
{
"format": "short",
"logBase": 1,
"max": null,
"min": 0,
"show": true
}
],
"yaxis": {
"align": false,
"alignLevel": null
}
},
{
"collapsed": false,
"datasource": null,
"gridPos": {
"h": 1,
"w": 24,
"x": 0,
"y": 27
},
"id": 386,
"panels": [],
"repeat": null,
"title": "Sorts",
"type": "row"
},
{
"aliasColors": {},
"bars": false,
"dashLength": 10,
"dashes": false,
"datasource": "Prometheus",
"decimals": 2,
"description": "**MySQL Sorts**\n\nDue to a query's structure, order, or other requirements, MySQL sorts the rows before returning them. For example, if a table is ordered 1 to 10 but you want the results reversed, MySQL then has to sort the rows to return 10 to 1.\n\nThis graph also shows when sorts had to scan a whole table or a given range of a table in order to return the results and which could not have been sorted via an index.",
"editable": true,
"error": false,
"fieldConfig": {
"defaults": {
"custom": {}
},
"overrides": []
},
"fill": 2,
"grid": {},
"gridPos": {
"h": 7,
"w": 12,
"x": 0,
"y": 28
},
"id": 30,
"legend": {
"alignAsTable": true,
"avg": true,
"current": false,
"hideZero": true,
"max": true,
"min": true,
"rightSide": false,
"show": true,
"sort": "avg",
"sortDesc": true,
"total": false,
"values": true
},
"lines": true,
"linewidth": 2,
"links": [],
"nullPointMode": "null",
"paceLength": 10,
"percentage": false,
"pointradius": 5,
"points": false,
"renderer": "flot",
"seriesOverrides": [],
"spaceLength": 10,
"stack": false,
"steppedLine": false,
"targets": [
{
"calculatedInterval": "2m",
"datasourceErrors": {},
"errors": {},
"expr": "rate(mysql_global_status_sort_rows{instance=\"$host\"}[$interval]) or irate(mysql_global_status_sort_rows{instance=\"$host\"}[5m])",
"format": "time_series",
"interval": "$interval",
"intervalFactor": 1,
"legendFormat": "Sort Rows",
"metric": "",
"refId": "A",
"step": 20
},
{
"calculatedInterval": "2m",
"datasourceErrors": {},
"errors": {},
"expr": "rate(mysql_global_status_sort_range{instance=\"$host\"}[$interval]) or irate(mysql_global_status_sort_range{instance=\"$host\"}[5m])",
"format": "time_series",
"interval": "$interval",
"intervalFactor": 1,
"legendFormat": "Sort Range",
"metric": "",
"refId": "B",
"step": 20
},
{
"calculatedInterval": "2m",
"datasourceErrors": {},
"errors": {},
"expr": "rate(mysql_global_status_sort_merge_passes{instance=\"$host\"}[$interval]) or irate(mysql_global_status_sort_merge_passes{instance=\"$host\"}[5m])",
"format": "time_series",
"interval": "$interval",
"intervalFactor": 1,
"legendFormat": "Sort Merge Passes",
"metric": "",
"refId": "C",
"step": 20
},
{
"calculatedInterval": "2m",
"datasourceErrors": {},
"errors": {},
"expr": "rate(mysql_global_status_sort_scan{instance=\"$host\"}[$interval]) or irate(mysql_global_status_sort_scan{instance=\"$host\"}[5m])",
"format": "time_series",
"interval": "$interval",
"intervalFactor": 1,
"legendFormat": "Sort Scan",
"metric": "",
"refId": "D",
"step": 20
}
],
"thresholds": [],
"timeFrom": null,
"timeRegions": [],
"timeShift": null,
"title": "MySQL Sorts",
"tooltip": {
"msResolution": false,
"shared": true,
"sort": 0,
"value_type": "individual"
},
"type": "graph",
"xaxis": {
"buckets": null,
"mode": "time",
"name": null,
"show": true,
"values": []
},
"yaxes": [
{
"format": "short",
"logBase": 1,
"max": null,
"min": 0,
"show": true
},
{
"format": "short",
"logBase": 1,
"max": null,
"min": 0,
"show": true
}
],
"yaxis": {
"align": false,
"alignLevel": null
}
},
{
"aliasColors": {},
"bars": false,
"dashLength": 10,
"dashes": false,
"datasource": "Prometheus",
"decimals": 2,
"description": "**MySQL Slow Queries**\n\nSlow queries are defined as queries being slower than the long_query_time setting. For example, if you have long_query_time set to 3, all queries that take longer than 3 seconds to complete will show on this graph.",
"editable": true,
"error": false,
"fieldConfig": {
"defaults": {
"custom": {}
},
"overrides": []
},
"fill": 2,
"grid": {},
"gridPos": {
"h": 7,
"w": 12,
"x": 12,
"y": 28
},
"id": 48,
"legend": {
"alignAsTable": true,
"avg": true,
"current": false,
"max": true,
"min": true,
"show": true,
"sort": "avg",
"sortDesc": true,
"total": false,
"values": true
},
"lines": true,
"linewidth": 2,
"links": [],
"nullPointMode": "null",
"paceLength": 10,
"percentage": false,
"pointradius": 5,
"points": false,
"renderer": "flot",
"seriesOverrides": [],
"spaceLength": 10,
"stack": false,
"steppedLine": false,
"targets": [
{
"calculatedInterval": "2m",
"datasourceErrors": {},
"errors": {},
"expr": "rate(mysql_global_status_slow_queries{instance=\"$host\"}[$interval]) or irate(mysql_global_status_slow_queries{instance=\"$host\"}[5m])",
"format": "time_series",
"interval": "$interval",
"intervalFactor": 1,
"legendFormat": "Slow Queries",
"metric": "",
"refId": "A",
"step": 20
}
],
"thresholds": [],
"timeFrom": null,
"timeRegions": [],
"timeShift": null,
"title": "MySQL Slow Queries",
"tooltip": {
"msResolution": false,
"shared": true,
"sort": 0,
"value_type": "cumulative"
},
"type": "graph",
"xaxis": {
"buckets": null,
"mode": "time",
"name": null,
"show": true,
"values": []
},
"yaxes": [
{
"format": "short",
"label": "",
"logBase": 1,
"max": null,
"min": 0,
"show": true
},
{
"format": "short",
"label": "",
"logBase": 1,
"max": null,
"min": 0,
"show": true
}
],
"yaxis": {
"align": false,
"alignLevel": null
}
},
{
"collapsed": false,
"datasource": null,
"gridPos": {
"h": 1,
"w": 24,
"x": 0,
"y": 35
},
"id": 387,
"panels": [],
"repeat": null,
"title": "Aborted",
"type": "row"
},
{
"aliasColors": {},
"bars": false,
"dashLength": 10,
"dashes": false,
"datasource": "Prometheus",
"decimals": 2,
"description": "**Aborted Connections**\n\nWhen a given host connects to MySQL and the connection is interrupted in the middle (for example due to bad credentials), MySQL keeps that info in a system table (since 5.6 this table is exposed in performance_schema).\n\nIf the amount of failed requests without a successful connection reaches the value of max_connect_errors, mysqld assumes that something is wrong and blocks the host from further connection.\n\nTo allow connections from that host again, you need to issue the ``FLUSH HOSTS`` statement.",
"editable": true,
"error": false,
"fieldConfig": {
"defaults": {
"custom": {}
},
"overrides": []
},
"fill": 2,
"grid": {},
"gridPos": {
"h": 7,
"w": 12,
"x": 0,
"y": 36
},
"id": 47,
"legend": {
"alignAsTable": true,
"avg": true,
"current": false,
"max": true,
"min": true,
"show": true,
"sort": "avg",
"sortDesc": true,
"total": false,
"values": true
},
"lines": true,
"linewidth": 2,
"links": [],
"nullPointMode": "null",
"paceLength": 10,
"percentage": false,
"pointradius": 5,
"points": false,
"renderer": "flot",
"seriesOverrides": [],
"spaceLength": 10,
"stack": false,
"steppedLine": false,
"targets": [
{
"calculatedInterval": "2m",
"datasourceErrors": {},
"errors": {},
"expr": "rate(mysql_global_status_aborted_connects{instance=\"$host\"}[$interval]) or irate(mysql_global_status_aborted_connects{instance=\"$host\"}[5m])",
"format": "time_series",
"interval": "$interval",
"intervalFactor": 1,
"legendFormat": "Aborted Connects (attempts)",
"metric": "",
"refId": "A",
"step": 20
},
{
"calculatedInterval": "2m",
"datasourceErrors": {},
"errors": {},
"expr": "rate(mysql_global_status_aborted_clients{instance=\"$host\"}[$interval]) or irate(mysql_global_status_aborted_clients{instance=\"$host\"}[5m])",
"format": "time_series",
"interval": "$interval",
"intervalFactor": 1,
"legendFormat": "Aborted Clients (timeout)",
"metric": "",
"refId": "B",
"step": 20,
"target": ""
}
],
"thresholds": [],
"timeFrom": null,
"timeRegions": [],
"timeShift": null,
"title": "MySQL Aborted Connections",
"tooltip": {
"msResolution": false,
"shared": true,
"sort": 0,
"value_type": "cumulative"
},
"type": "graph",
"xaxis": {
"buckets": null,
"mode": "time",
"name": null,
"show": true,
"values": []
},
"yaxes": [
{
"format": "short",
"label": "",
"logBase": 1,
"max": null,
"min": 0,
"show": true
},
{
"format": "short",
"label": "",
"logBase": 1,
"max": null,
"min": 0,
"show": true
}
],
"yaxis": {
"align": false,
"alignLevel": null
}
},
{
"aliasColors": {},
"bars": false,
"dashLength": 10,
"dashes": false,
"datasource": "Prometheus",
"decimals": 2,
"description": "**Table Locks**\n\nMySQL takes a number of different locks for varying reasons. In this graph we see how many Table level locks MySQL has requested from the storage engine. In the case of InnoDB, many times the locks could actually be row locks as it only takes table level locks in a few specific cases.\n\nIt is most useful to compare Locks Immediate and Locks Waited. If Locks waited is rising, it means you have lock contention. Otherwise, Locks Immediate rising and falling is normal activity.",
"editable": true,
"error": false,
"fieldConfig": {
"defaults": {
"custom": {}
},
"overrides": []
},
"fill": 2,
"grid": {},
"gridPos": {
"h": 7,
"w": 12,
"x": 12,
"y": 36
},
"id": 32,
"legend": {
"alignAsTable": true,
"avg": true,
"current": false,
"max": true,
"min": true,
"rightSide": false,
"show": true,
"sort": "avg",
"sortDesc": true,
"total": false,
"values": true
},
"lines": true,
"linewidth": 2,
"links": [],
"nullPointMode": "null",
"paceLength": 10,
"percentage": false,
"pointradius": 5,
"points": false,
"renderer": "flot",
"seriesOverrides": [],
"spaceLength": 10,
"stack": false,
"steppedLine": false,
"targets": [
{
"calculatedInterval": "2m",
"datasourceErrors": {},
"errors": {},
"expr": "rate(mysql_global_status_table_locks_immediate{instance=\"$host\"}[$interval]) or irate(mysql_global_status_table_locks_immediate{instance=\"$host\"}[5m])",
"format": "time_series",
"interval": "$interval",
"intervalFactor": 1,
"legendFormat": "Table Locks Immediate",
"metric": "",
"refId": "A",
"step": 20
},
{
"calculatedInterval": "2m",
"datasourceErrors": {},
"errors": {},
"expr": "rate(mysql_global_status_table_locks_waited{instance=\"$host\"}[$interval]) or irate(mysql_global_status_table_locks_waited{instance=\"$host\"}[5m])",
"format": "time_series",
"interval": "$interval",
"intervalFactor": 1,
"legendFormat": "Table Locks Waited",
"metric": "",
"refId": "B",
"step": 20
}
],
"thresholds": [],
"timeFrom": null,
"timeRegions": [],
"timeShift": null,
"title": "MySQL Table Locks",
"tooltip": {
"msResolution": false,
"shared": true,
"sort": 0,
"value_type": "individual"
},
"type": "graph",
"xaxis": {
"buckets": null,
"mode": "time",
"name": null,
"show": true,
"values": []
},
"yaxes": [
{
"format": "short",
"logBase": 1,
"max": null,
"min": 0,
"show": true
},
{
"format": "short",
"logBase": 1,
"max": null,
"min": 0,
"show": true
}
],
"yaxis": {
"align": false,
"alignLevel": null
}
},
{
"collapsed": false,
"datasource": null,
"gridPos": {
"h": 1,
"w": 24,
"x": 0,
"y": 43
},
"id": 388,
"panels": [],
"repeat": null,
"title": "Network",
"type": "row"
},
{
"aliasColors": {},
"bars": false,
"dashLength": 10,
"dashes": false,
"datasource": "Prometheus",
"decimals": 2,
"description": "**MySQL Network Traffic**\n\nHere we can see how much network traffic is generated by MySQL. Outbound is network traffic sent from MySQL and Inbound is network traffic MySQL has received.",
"editable": true,
"error": false,
"fieldConfig": {
"defaults": {
"custom": {}
},
"overrides": []
},
"fill": 6,
"grid": {},
"gridPos": {
"h": 7,
"w": 12,
"x": 0,
"y": 44
},
"id": 9,
"legend": {
"alignAsTable": true,
"avg": true,
"current": false,
"max": true,
"min": true,
"rightSide": false,
"show": true,
"sort": "avg",
"sortDesc": true,
"total": false,
"values": true
},
"lines": true,
"linewidth": 2,
"links": [],
"nullPointMode": "null",
"paceLength": 10,
"percentage": false,
"pointradius": 5,
"points": false,
"renderer": "flot",
"seriesOverrides": [],
"spaceLength": 10,
"stack": true,
"steppedLine": false,
"targets": [
{
"calculatedInterval": "2m",
"datasourceErrors": {},
"errors": {},
"expr": "rate(mysql_global_status_bytes_received{instance=\"$host\"}[$interval]) or irate(mysql_global_status_bytes_received{instance=\"$host\"}[5m])",
"format": "time_series",
"interval": "$interval",
"intervalFactor": 1,
"legendFormat": "Inbound",
"metric": "",
"refId": "A",
"step": 20
},
{
"calculatedInterval": "2m",
"datasourceErrors": {},
"errors": {},
"expr": "rate(mysql_global_status_bytes_sent{instance=\"$host\"}[$interval]) or irate(mysql_global_status_bytes_sent{instance=\"$host\"}[5m])",
"format": "time_series",
"interval": "$interval",
"intervalFactor": 1,
"legendFormat": "Outbound",
"metric": "",
"refId": "B",
"step": 20
}
],
"thresholds": [],
"timeFrom": null,
"timeRegions": [],
"timeShift": null,
"title": "MySQL Network Traffic",
"tooltip": {
"msResolution": false,
"shared": true,
"sort": 0,
"value_type": "individual"
},
"type": "graph",
"xaxis": {
"buckets": null,
"mode": "time",
"name": null,
"show": true,
"values": []
},
"yaxes": [
{
"format": "Bps",
"logBase": 1,
"max": null,
"min": 0,
"show": true
},
{
"format": "none",
"logBase": 1,
"max": null,
"min": 0,
"show": true
}
],
"yaxis": {
"align": false,
"alignLevel": null
}
},
{
"aliasColors": {},
"bars": true,
"dashLength": 10,
"dashes": false,
"datasource": "Prometheus",
"decimals": 2,
"description": "**MySQL Network Usage Hourly**\n\nHere we can see how much network traffic is generated by MySQL per hour. You can use the bar graph to compare data sent by MySQL and data received by MySQL.",
"editable": true,
"error": false,
"fieldConfig": {
"defaults": {
"custom": {}
},
"overrides": []
},
"fill": 6,
"grid": {},
"gridPos": {
"h": 7,
"w": 12,
"x": 12,
"y": 44
},
"height": "250px",
"id": 381,
"legend": {
"alignAsTable": true,
"avg": true,
"current": false,
"max": true,
"min": true,
"rightSide": false,
"show": true,
"sort": "avg",
"sortDesc": true,
"total": false,
"values": true
},
"lines": false,
"linewidth": 2,
"links": [],
"nullPointMode": "null",
"paceLength": 10,
"percentage": false,
"pointradius": 5,
"points": false,
"renderer": "flot",
"seriesOverrides": [],
"spaceLength": 10,
"stack": true,
"steppedLine": false,
"targets": [
{
"calculatedInterval": "2m",
"datasourceErrors": {},
"errors": {},
"expr": "increase(mysql_global_status_bytes_received{instance=\"$host\"}[1h])",
"format": "time_series",
"interval": "1h",
"intervalFactor": 1,
"legendFormat": "Received",
"metric": "",
"refId": "A",
"step": 3600
},
{
"calculatedInterval": "2m",
"datasourceErrors": {},
"errors": {},
"expr": "increase(mysql_global_status_bytes_sent{instance=\"$host\"}[1h])",
"format": "time_series",
"interval": "1h",
"intervalFactor": 1,
"legendFormat": "Sent",
"metric": "",
"refId": "B",
"step": 3600
}
],
"thresholds": [],
"timeFrom": "24h",
"timeRegions": [],
"timeShift": null,
"title": "MySQL Network Usage Hourly",
"tooltip": {
"msResolution": false,
"shared": true,
"sort": 0,
"value_type": "individual"
},
"type": "graph",
"xaxis": {
"buckets": null,
"mode": "time",
"name": null,
"show": true,
"values": []
},
"yaxes": [
{
"format": "bytes",
"logBase": 1,
"max": null,
"min": 0,
"show": true
},
{
"format": "none",
"logBase": 1,
"max": null,
"min": 0,
"show": true
}
],
"yaxis": {
"align": false,
"alignLevel": null
}
},
{
"collapsed": false,
"datasource": null,
"gridPos": {
"h": 1,
"w": 24,
"x": 0,
"y": 51
},
"id": 389,
"panels": [],
"repeat": null,
"title": "Memory",
"type": "row"
},
{
"aliasColors": {},
"bars": false,
"dashLength": 10,
"dashes": false,
"datasource": "Prometheus",
"decimals": 0,
"description": "***System Memory***: Total Memory for the system.\\\n***InnoDB Buffer Pool Data***: InnoDB maintains a storage area called the buffer pool for caching data and indexes in memory.\\\n***TokuDB Cache Size***: Similar in function to the InnoDB Buffer Pool, TokuDB will allocate 50% of the installed RAM for its own cache.\\\n***Key Buffer Size***: Index blocks for MYISAM tables are buffered and are shared by all threads. key_buffer_size is the size of the buffer used for index blocks.\\\n***Adaptive Hash Index Size***: When InnoDB notices that some index values are being accessed very frequently, it builds a hash index for them in memory on top of B-Tree indexes.\\\n ***Query Cache Size***: The query cache stores the text of a SELECT statement together with the corresponding result that was sent to the client. The query cache has huge scalability problems in that only one thread can do an operation in the query cache at the same time.\\\n***InnoDB Dictionary Size***: The data dictionary is InnoDB ‘s internal catalog of tables. InnoDB stores the data dictionary on disk, and loads entries into memory while the server is running.\\\n***InnoDB Log Buffer Size***: The MySQL InnoDB log buffer allows transactions to run without having to write the log to disk before the transactions commit.",
"editable": true,
"error": false,
"fieldConfig": {
"defaults": {
"custom": {}
},
"overrides": []
},
"fill": 6,
"grid": {},
"gridPos": {
"h": 7,
"w": 24,
"x": 0,
"y": 52
},
"id": 50,
"legend": {
"alignAsTable": true,
"avg": true,
"current": false,
"hideEmpty": true,
"hideZero": true,
"max": true,
"min": true,
"rightSide": true,
"show": true,
"sort": "avg",
"sortDesc": true,
"total": false,
"values": true
},
"lines": true,
"linewidth": 2,
"links": [
{
"title": "Detailed descriptions about metrics",
"url": "https://www.percona.com/doc/percona-monitoring-and-management/dashboard.mysql-overview.html#mysql-internal-memory-overview"
}
],
"nullPointMode": "null",
"paceLength": 10,
"percentage": false,
"pointradius": 5,
"points": false,
"renderer": "flot",
"seriesOverrides": [
{
"alias": "System Memory",
"fill": 0,
"stack": false
}
],
"spaceLength": 10,
"stack": true,
"steppedLine": false,
"targets": [
{
"expr": "node_memory_MemTotal{instance=\"$host\"}",
"format": "time_series",
"intervalFactor": 2,
"legendFormat": "System Memory",
"refId": "G",
"step": 4
},
{
"expr": "mysql_global_status_innodb_page_size{instance=\"$host\"} * on (instance) mysql_global_status_buffer_pool_pages{instance=\"$host\",state=\"data\"}",
"format": "time_series",
"hide": false,
"interval": "$interval",
"intervalFactor": 1,
"legendFormat": "InnoDB Buffer Pool Data",
"refId": "A",
"step": 20
},
{
"expr": "mysql_global_variables_innodb_log_buffer_size{instance=\"$host\"}",
"format": "time_series",
"interval": "$interval",
"intervalFactor": 1,
"legendFormat": "InnoDB Log Buffer Size",
"refId": "D",
"step": 20
},
{
"expr": "mysql_global_variables_innodb_additional_mem_pool_size{instance=\"$host\"}",
"format": "time_series",
"interval": "$interval",
"intervalFactor": 2,
"legendFormat": "InnoDB Additional Memory Pool Size",
"refId": "H",
"step": 40
},
{
"expr": "mysql_global_status_innodb_mem_dictionary{instance=\"$host\"}",
"format": "time_series",
"interval": "$interval",
"intervalFactor": 1,
"legendFormat": "InnoDB Dictionary Size",
"refId": "F",
"step": 20
},
{
"expr": "mysql_global_variables_key_buffer_size{instance=\"$host\"}",
"format": "time_series",
"interval": "$interval",
"intervalFactor": 1,
"legendFormat": "Key Buffer Size",
"refId": "B",
"step": 20
},
{
"expr": "mysql_global_variables_query_cache_size{instance=\"$host\"}",
"format": "time_series",
"interval": "$interval",
"intervalFactor": 1,
"legendFormat": "Query Cache Size",
"refId": "C",
"step": 20
},
{
"expr": "mysql_global_status_innodb_mem_adaptive_hash{instance=\"$host\"}",
"format": "time_series",
"interval": "$interval",
"intervalFactor": 1,
"legendFormat": "Adaptive Hash Index Size",
"refId": "E",
"step": 20
},
{
"expr": "mysql_global_variables_tokudb_cache_size{instance=\"$host\"}",
"format": "time_series",
"interval": "$interval",
"intervalFactor": 1,
"legendFormat": "TokuDB Cache Size",
"refId": "I",
"step": 20
}
],
"thresholds": [],
"timeFrom": null,
"timeRegions": [],
"timeShift": null,
"title": "MySQL Internal Memory Overview",
"tooltip": {
"msResolution": false,
"shared": true,
"sort": 0,
"value_type": "individual"
},
"type": "graph",
"xaxis": {
"buckets": null,
"mode": "time",
"name": null,
"show": true,
"values": []
},
"yaxes": [
{
"format": "bytes",
"label": "",
"logBase": 1,
"max": null,
"min": 0,
"show": true
},
{
"format": "short",
"label": null,
"logBase": 1,
"max": null,
"min": null,
"show": true
}
],
"yaxis": {
"align": false,
"alignLevel": null
}
},
{
"collapsed": false,
"datasource": null,
"gridPos": {
"h": 1,
"w": 24,
"x": 0,
"y": 59
},
"id": 390,
"panels": [],
"repeat": null,
"title": "Command, Handlers, Processes",
"type": "row"
},
{
"aliasColors": {},
"bars": false,
"dashLength": 10,
"dashes": false,
"datasource": "Prometheus",
"decimals": 2,
"description": "**Top Command Counters**\n\nThe Com_{{xxx}} statement counter variables indicate the number of times each xxx statement has been executed. There is one status variable for each type of statement. For example, Com_delete and Com_update count [``DELETE``](https://dev.mysql.com/doc/refman/5.7/en/delete.html) and [``UPDATE``](https://dev.mysql.com/doc/refman/5.7/en/update.html) statements, respectively. Com_delete_multi and Com_update_multi are similar but apply to [``DELETE``](https://dev.mysql.com/doc/refman/5.7/en/delete.html) and [``UPDATE``](https://dev.mysql.com/doc/refman/5.7/en/update.html) statements that use multiple-table syntax.",
"editable": true,
"error": false,
"fieldConfig": {
"defaults": {
"custom": {}
},
"overrides": []
},
"fill": 2,
"grid": {},
"gridPos": {
"h": 7,
"w": 24,
"x": 0,
"y": 60
},
"id": 14,
"legend": {
"alignAsTable": true,
"avg": true,
"current": false,
"hideEmpty": false,
"hideZero": false,
"max": true,
"min": true,
"rightSide": true,
"show": true,
"sort": "avg",
"sortDesc": true,
"total": false,
"values": true
},
"lines": true,
"linewidth": 2,
"links": [
{
"title": "Server Status Variables (Com_xxx)",
"url": "https://dev.mysql.com/doc/refman/5.7/en/server-status-variables.html#statvar_Com_xxx"
}
],
"nullPointMode": "null as zero",
"paceLength": 10,
"percentage": false,
"pointradius": 5,
"points": false,
"renderer": "flot",
"seriesOverrides": [],
"spaceLength": 10,
"stack": false,
"steppedLine": false,
"targets": [
{
"calculatedInterval": "2m",
"datasourceErrors": {},
"errors": {},
"expr": "topk(5, rate(mysql_global_status_commands_total{instance=\"$host\"}[$interval])>0) or irate(mysql_global_status_commands_total{instance=\"$host\"}[5m])>0",
"format": "time_series",
"hide": false,
"interval": "$interval",
"intervalFactor": 1,
"legendFormat": "Com_{{ command }}",
"metric": "",
"refId": "B",
"step": 20
}
],
"thresholds": [],
"timeFrom": null,
"timeRegions": [],
"timeShift": null,
"title": "Top Command Counters",
"tooltip": {
"msResolution": false,
"shared": true,
"sort": 0,
"value_type": "individual"
},
"type": "graph",
"xaxis": {
"buckets": null,
"mode": "time",
"name": null,
"show": true,
"values": []
},
"yaxes": [
{
"format": "short",
"logBase": 1,
"max": null,
"min": 0,
"show": true
},
{
"format": "short",
"logBase": 1,
"max": null,
"min": 0,
"show": true
}
],
"yaxis": {
"align": false,
"alignLevel": null
}
},
{
"aliasColors": {},
"bars": true,
"dashLength": 10,
"dashes": false,
"datasource": "Prometheus",
"decimals": 2,
"description": "**Top Command Counters Hourly**\n\nThe Com_{{xxx}} statement counter variables indicate the number of times each xxx statement has been executed. There is one status variable for each type of statement. For example, Com_delete and Com_update count [``DELETE``](https://dev.mysql.com/doc/refman/5.7/en/delete.html) and [``UPDATE``](https://dev.mysql.com/doc/refman/5.7/en/update.html) statements, respectively. Com_delete_multi and Com_update_multi are similar but apply to [``DELETE``](https://dev.mysql.com/doc/refman/5.7/en/delete.html) and [``UPDATE``](https://dev.mysql.com/doc/refman/5.7/en/update.html) statements that use multiple-table syntax.",
"editable": true,
"error": false,
"fieldConfig": {
"defaults": {
"custom": {}
},
"overrides": []
},
"fill": 6,
"grid": {},
"gridPos": {
"h": 7,
"w": 24,
"x": 0,
"y": 67
},
"id": 39,
"legend": {
"alignAsTable": true,
"avg": true,
"current": false,
"max": true,
"min": true,
"rightSide": true,
"show": true,
"sort": "avg",
"sortDesc": true,
"total": false,
"values": true
},
"lines": false,
"linewidth": 2,
"links": [
{
"title": "Server Status Variables (Com_xxx)",
"url": "https://dev.mysql.com/doc/refman/5.7/en/server-status-variables.html#statvar_Com_xxx"
}
],
"nullPointMode": "null",
"paceLength": 10,
"percentage": false,
"pointradius": 5,
"points": false,
"renderer": "flot",
"seriesOverrides": [],
"spaceLength": 10,
"stack": true,
"steppedLine": false,
"targets": [
{
"calculatedInterval": "2m",
"datasourceErrors": {},
"errors": {},
"expr": "topk(5, increase(mysql_global_status_commands_total{instance=\"$host\"}[1h])>0)",
"format": "time_series",
"interval": "1h",
"intervalFactor": 1,
"legendFormat": "Com_{{ command }}",
"metric": "",
"refId": "A",
"step": 3600
}
],
"thresholds": [],
"timeFrom": "24h",
"timeRegions": [],
"timeShift": null,
"title": "Top Command Counters Hourly",
"tooltip": {
"msResolution": false,
"shared": true,
"sort": 0,
"value_type": "individual"
},
"type": "graph",
"xaxis": {
"buckets": null,
"mode": "time",
"name": null,
"show": true,
"values": []
},
"yaxes": [
{
"format": "short",
"logBase": 1,
"max": null,
"min": 0,
"show": true
},
{
"format": "short",
"logBase": 1,
"max": null,
"min": 0,
"show": true
}
],
"yaxis": {
"align": false,
"alignLevel": null
}
},
{
"aliasColors": {},
"bars": false,
"dashLength": 10,
"dashes": false,
"datasource": "Prometheus",
"decimals": 2,
"description": "**MySQL Handlers**\n\nHandler statistics are internal statistics on how MySQL is selecting, updating, inserting, and modifying rows, tables, and indexes.\n\nThis is in fact the layer between the Storage Engine and MySQL.\n\n* `read_rnd_next` is incremented when the server performs a full table scan and this is a counter you don't really want to see with a high value.\n* `read_key` is incremented when a read is done with an index.\n* `read_next` is incremented when the storage engine is asked to 'read the next index entry'. A high value means a lot of index scans are being done.",
"editable": true,
"error": false,
"fieldConfig": {
"defaults": {
"custom": {}
},
"overrides": []
},
"fill": 2,
"grid": {},
"gridPos": {
"h": 7,
"w": 24,
"x": 0,
"y": 74
},
"id": 8,
"legend": {
"alignAsTable": true,
"avg": true,
"current": false,
"hideZero": true,
"max": true,
"min": true,
"rightSide": true,
"show": true,
"sort": "avg",
"sortDesc": true,
"total": false,
"values": true
},
"lines": true,
"linewidth": 2,
"links": [],
"nullPointMode": "null",
"paceLength": 10,
"percentage": false,
"pointradius": 5,
"points": false,
"renderer": "flot",
"seriesOverrides": [],
"spaceLength": 10,
"stack": false,
"steppedLine": false,
"targets": [
{
"calculatedInterval": "2m",
"datasourceErrors": {},
"errors": {},
"expr": "rate(mysql_global_status_handlers_total{instance=\"$host\", handler!~\"commit|rollback|savepoint.*|prepare\"}[$interval]) or irate(mysql_global_status_handlers_total{instance=\"$host\", handler!~\"commit|rollback|savepoint.*|prepare\"}[5m])",
"format": "time_series",
"interval": "$interval",
"intervalFactor": 1,
"legendFormat": "{{ handler }}",
"metric": "",
"refId": "J",
"step": 20
}
],
"thresholds": [],
"timeFrom": null,
"timeRegions": [],
"timeShift": null,
"title": "MySQL Handlers",
"tooltip": {
"msResolution": false,
"shared": true,
"sort": 0,
"value_type": "individual"
},
"type": "graph",
"xaxis": {
"buckets": null,
"mode": "time",
"name": null,
"show": true,
"values": []
},
"yaxes": [
{
"format": "short",
"logBase": 1,
"max": null,
"min": 0,
"show": true
},
{
"format": "short",
"logBase": 1,
"max": null,
"min": 0,
"show": true
}
],
"yaxis": {
"align": false,
"alignLevel": null
}
},
{
"aliasColors": {},
"bars": false,
"dashLength": 10,
"dashes": false,
"datasource": "Prometheus",
"decimals": 2,
"editable": true,
"error": false,
"fieldConfig": {
"defaults": {
"custom": {}
},
"overrides": []
},
"fill": 2,
"grid": {},
"gridPos": {
"h": 7,
"w": 24,
"x": 0,
"y": 81
},
"id": 28,
"legend": {
"alignAsTable": true,
"avg": true,
"current": false,
"hideZero": true,
"max": true,
"min": true,
"rightSide": true,
"show": true,
"sort": "avg",
"sortDesc": true,
"total": false,
"values": true
},
"lines": true,
"linewidth": 2,
"links": [],
"nullPointMode": "null",
"paceLength": 10,
"percentage": false,
"pointradius": 5,
"points": false,
"renderer": "flot",
"seriesOverrides": [],
"spaceLength": 10,
"stack": false,
"steppedLine": false,
"targets": [
{
"calculatedInterval": "2m",
"datasourceErrors": {},
"errors": {},
"expr": "rate(mysql_global_status_handlers_total{instance=\"$host\", handler=~\"commit|rollback|savepoint.*|prepare\"}[$interval]) or irate(mysql_global_status_handlers_total{instance=\"$host\", handler=~\"commit|rollback|savepoint.*|prepare\"}[5m])",
"interval": "$interval",
"intervalFactor": 1,
"legendFormat": "{{ handler }}",
"metric": "",
"refId": "A",
"step": 20
}
],
"thresholds": [],
"timeFrom": null,
"timeRegions": [],
"timeShift": null,
"title": "MySQL Transaction Handlers",
"tooltip": {
"msResolution": false,
"shared": true,
"sort": 0,
"value_type": "individual"
},
"type": "graph",
"xaxis": {
"buckets": null,
"mode": "time",
"name": null,
"show": true,
"values": []
},
"yaxes": [
{
"format": "short",
"logBase": 1,
"max": null,
"min": 0,
"show": true
},
{
"format": "short",
"logBase": 1,
"max": null,
"min": 0,
"show": true
}
],
"yaxis": {
"align": false,
"alignLevel": null
}
},
{
"aliasColors": {},
"bars": false,
"dashLength": 10,
"dashes": false,
"datasource": "Prometheus",
"decimals": 2,
"editable": true,
"error": false,
"fieldConfig": {
"defaults": {
"custom": {}
},
"overrides": []
},
"fill": 0,
"grid": {},
"gridPos": {
"h": 7,
"w": 24,
"x": 0,
"y": 88
},
"id": 40,
"legend": {
"alignAsTable": true,
"avg": true,
"current": false,
"hideZero": true,
"max": true,
"min": false,
"rightSide": true,
"show": true,
"sort": "avg",
"sortDesc": true,
"total": false,
"values": true
},
"lines": true,
"linewidth": 2,
"links": [],
"nullPointMode": "null as zero",
"paceLength": 10,
"percentage": false,
"pointradius": 5,
"points": false,
"renderer": "flot",
"seriesOverrides": [],
"spaceLength": 10,
"stack": false,
"steppedLine": false,
"targets": [
{
"calculatedInterval": "2m",
"datasourceErrors": {},
"errors": {},
"expr": "mysql_info_schema_threads{instance=\"$host\"}",
"format": "time_series",
"interval": "$interval",
"intervalFactor": 1,
"legendFormat": "{{ state }}",
"metric": "",
"refId": "A",
"step": 20
}
],
"thresholds": [],
"timeFrom": null,
"timeRegions": [],
"timeShift": null,
"title": "Process States",
"tooltip": {
"msResolution": false,
"shared": true,
"sort": 0,
"value_type": "individual"
},
"type": "graph",
"xaxis": {
"buckets": null,
"mode": "time",
"name": null,
"show": true,
"values": []
},
"yaxes": [
{
"format": "short",
"logBase": 1,
"max": null,
"min": 0,
"show": true
},
{
"format": "short",
"logBase": 1,
"max": null,
"min": 0,
"show": true
}
],
"yaxis": {
"align": false,
"alignLevel": null
}
},
{
"aliasColors": {},
"bars": true,
"dashLength": 10,
"dashes": false,
"datasource": "Prometheus",
"decimals": 2,
"editable": true,
"error": false,
"fieldConfig": {
"defaults": {
"custom": {}
},
"overrides": []
},
"fill": 6,
"grid": {},
"gridPos": {
"h": 7,
"w": 24,
"x": 0,
"y": 95
},
"id": 49,
"legend": {
"alignAsTable": true,
"avg": true,
"current": false,
"hideZero": true,
"max": true,
"min": false,
"rightSide": true,
"show": true,
"sort": "avg",
"sortDesc": true,
"total": false,
"values": true
},
"lines": false,
"linewidth": 2,
"links": [],
"nullPointMode": "null",
"paceLength": 10,
"percentage": false,
"pointradius": 5,
"points": false,
"renderer": "flot",
"seriesOverrides": [],
"spaceLength": 10,
"stack": true,
"steppedLine": false,
"targets": [
{
"calculatedInterval": "2m",
"datasourceErrors": {},
"errors": {},
"expr": "topk(5, avg_over_time(mysql_info_schema_threads{instance=\"$host\"}[1h]))",
"interval": "1h",
"intervalFactor": 1,
"legendFormat": "{{ state }}",
"metric": "",
"refId": "A",
"step": 3600
}
],
"thresholds": [],
"timeFrom": "24h",
"timeRegions": [],
"timeShift": null,
"title": "Top Process States Hourly",
"tooltip": {
"msResolution": false,
"shared": true,
"sort": 0,
"value_type": "individual"
},
"type": "graph",
"xaxis": {
"buckets": null,
"mode": "time",
"name": null,
"show": true,
"values": []
},
"yaxes": [
{
"format": "short",
"logBase": 1,
"max": null,
"min": 0,
"show": true
},
{
"format": "short",
"logBase": 1,
"max": null,
"min": 0,
"show": true
}
],
"yaxis": {
"align": false,
"alignLevel": null
}
},
{
"collapsed": false,
"datasource": null,
"gridPos": {
"h": 1,
"w": 24,
"x": 0,
"y": 102
},
"id": 391,
"panels": [],
"repeat": null,
"title": "Query Cache",
"type": "row"
},
{
"aliasColors": {},
"bars": false,
"dashLength": 10,
"dashes": false,
"datasource": "Prometheus",
"decimals": 2,
"description": "**MySQL Query Cache Memory**\n\nThe query cache has huge scalability problems in that only one thread can do an operation in the query cache at the same time. This serialization is true not only for SELECTs, but also for INSERT/UPDATE/DELETE.\n\nThis also means that the larger the `query_cache_size` is set to, the slower those operations become. In concurrent environments, the MySQL Query Cache quickly becomes a contention point, decreasing performance. MariaDB and AWS Aurora have done work to try and eliminate the query cache contention in their flavors of MySQL, while MySQL 8.0 has eliminated the query cache feature.\n\nThe recommended settings for most environments is to set:\n ``query_cache_type=0``\n ``query_cache_size=0``\n\nNote that while you can dynamically change these values, to completely remove the contention point you have to restart the database.",
"editable": true,
"error": false,
"fieldConfig": {
"defaults": {
"custom": {}
},
"overrides": []
},
"fill": 2,
"grid": {},
"gridPos": {
"h": 7,
"w": 12,
"x": 0,
"y": 103
},
"id": 46,
"legend": {
"alignAsTable": true,
"avg": true,
"current": false,
"max": true,
"min": true,
"rightSide": false,
"show": true,
"sort": "avg",
"sortDesc": true,
"total": false,
"values": true
},
"lines": true,
"linewidth": 2,
"links": [],
"nullPointMode": "null",
"paceLength": 10,
"percentage": false,
"pointradius": 5,
"points": false,
"renderer": "flot",
"seriesOverrides": [],
"spaceLength": 10,
"stack": false,
"steppedLine": false,
"targets": [
{
"calculatedInterval": "2m",
"datasourceErrors": {},
"errors": {},
"expr": " (sum(mysql_global_status_buffer_pool_pages{instance=\"$host\"}) by (instance) - sum(mysql_global_status_buffer_pool_pages{state=\"free\"}) by (instance)) / sum(mysql_global_status_buffer_pool_pages) by (instance) * 100",
"format": "time_series",
"interval": "$interval",
"intervalFactor": 1,
"legendFormat": "缓冲池使用率",
"metric": "",
"refId": "F",
"step": 20
},
{
"calculatedInterval": "2m",
"datasourceErrors": {},
"errors": {},
"expr": "100",
"format": "time_series",
"interval": "$interval",
"intervalFactor": 1,
"legendFormat": "缓冲池大小",
"metric": "",
"refId": "E",
"step": 20
}
],
"thresholds": [],
"timeFrom": null,
"timeRegions": [],
"timeShift": null,
"title": " mysql_global_status_buffer_pool_pages",
"tooltip": {
"msResolution": false,
"shared": true,
"sort": 0,
"value_type": "individual"
},
"type": "graph",
"xaxis": {
"buckets": null,
"mode": "time",
"name": null,
"show": true,
"values": []
},
"yaxes": [
{
"format": "percent",
"logBase": 1,
"max": null,
"min": 0,
"show": true
},
{
"format": "short",
"logBase": 1,
"max": null,
"min": 0,
"show": true
}
],
"yaxis": {
"align": false,
"alignLevel": null
}
},
{
"aliasColors": {},
"bars": false,
"dashLength": 10,
"dashes": false,
"datasource": "Prometheus",
"decimals": 2,
"description": "**MySQL Query Cache Activity**\n\nThe query cache has huge scalability problems in that only one thread can do an operation in the query cache at the same time. This serialization is true not only for SELECTs, but also for INSERT/UPDATE/DELETE.\n\nThis also means that the larger the `query_cache_size` is set to, the slower those operations become. In concurrent environments, the MySQL Query Cache quickly becomes a contention point, decreasing performance. MariaDB and AWS Aurora have done work to try and eliminate the query cache contention in their flavors of MySQL, while MySQL 8.0 has eliminated the query cache feature.\n\nThe recommended settings for most environments is to set:\n``query_cache_type=0``\n``query_cache_size=0``\n\nNote that while you can dynamically change these values, to completely remove the contention point you have to restart the database.",
"editable": true,
"error": false,
"fieldConfig": {
"defaults": {
"custom": {}
},
"overrides": []
},
"fill": 2,
"grid": {},
"gridPos": {
"h": 7,
"w": 12,
"x": 12,
"y": 103
},
"height": "",
"id": 45,
"legend": {
"alignAsTable": true,
"avg": true,
"current": false,
"max": true,
"min": true,
"rightSide": false,
"show": true,
"sort": "avg",
"sortDesc": true,
"total": false,
"values": true
},
"lines": true,
"linewidth": 2,
"links": [],
"nullPointMode": "null",
"paceLength": 10,
"percentage": false,
"pointradius": 5,
"points": false,
"renderer": "flot",
"seriesOverrides": [],
"spaceLength": 10,
"stack": false,
"steppedLine": false,
"targets": [
{
"expr": "mysql_slave_status_seconds_behind_master{instance=\"$host\"}",
"format": "time_series",
"intervalFactor": 1,
"legendFormat": "从库同步延迟率",
"refId": "A"
},
{
"expr": "180",
"format": "time_series",
"intervalFactor": 1,
"legendFormat": "阀值",
"refId": "B"
}
],
"thresholds": [],
"timeFrom": null,
"timeRegions": [],
"timeShift": null,
"title": "Mysql_master-slave_synchronization_delay",
"tooltip": {
"msResolution": false,
"shared": true,
"sort": 0,
"value_type": "individual"
},
"type": "graph",
"xaxis": {
"buckets": null,
"mode": "time",
"name": null,
"show": true,
"values": []
},
"yaxes": [
{
"format": "s",
"logBase": 1,
"max": null,
"min": 0,
"show": true
},
{
"format": "short",
"logBase": 1,
"max": null,
"min": 0,
"show": true
}
],
"yaxis": {
"align": false,
"alignLevel": null
}
},
{
"collapsed": false,
"datasource": null,
"gridPos": {
"h": 1,
"w": 24,
"x": 0,
"y": 110
},
"id": 392,
"panels": [],
"repeat": null,
"title": "Files and Tables",
"type": "row"
},
{
"aliasColors": {},
"bars": false,
"dashLength": 10,
"dashes": false,
"datasource": "Prometheus",
"decimals": 2,
"editable": true,
"error": false,
"fieldConfig": {
"defaults": {
"custom": {}
},
"overrides": []
},
"fill": 2,
"grid": {},
"gridPos": {
"h": 7,
"w": 12,
"x": 0,
"y": 111
},
"id": 43,
"legend": {
"alignAsTable": true,
"avg": true,
"current": false,
"max": true,
"min": true,
"rightSide": false,
"show": true,
"sort": "avg",
"sortDesc": true,
"total": false,
"values": true
},
"lines": true,
"linewidth": 2,
"links": [],
"nullPointMode": "null",
"paceLength": 10,
"percentage": false,
"pointradius": 5,
"points": false,
"renderer": "flot",
"seriesOverrides": [],
"spaceLength": 10,
"stack": false,
"steppedLine": false,
"targets": [
{
"calculatedInterval": "2m",
"datasourceErrors": {},
"errors": {},
"expr": "rate(mysql_global_status_opened_files{instance=\"$host\"}[$interval]) or irate(mysql_global_status_opened_files{instance=\"$host\"}[5m])",
"interval": "$interval",
"intervalFactor": 1,
"legendFormat": "Openings",
"metric": "",
"refId": "A",
"step": 20
}
],
"thresholds": [],
"timeFrom": null,
"timeRegions": [],
"timeShift": null,
"title": "MySQL File Openings",
"tooltip": {
"msResolution": false,
"shared": true,
"sort": 0,
"value_type": "individual"
},
"type": "graph",
"xaxis": {
"buckets": null,
"mode": "time",
"name": null,
"show": true,
"values": []
},
"yaxes": [
{
"format": "short",
"logBase": 1,
"max": null,
"min": 0,
"show": true
},
{
"format": "short",
"logBase": 1,
"max": null,
"min": 0,
"show": true
}
],
"yaxis": {
"align": false,
"alignLevel": null
}
},
{
"aliasColors": {},
"bars": false,
"dashLength": 10,
"dashes": false,
"datasource": "Prometheus",
"decimals": 2,
"editable": true,
"error": false,
"fieldConfig": {
"defaults": {
"custom": {}
},
"overrides": []
},
"fill": 2,
"grid": {},
"gridPos": {
"h": 7,
"w": 12,
"x": 12,
"y": 111
},
"id": 41,
"legend": {
"alignAsTable": true,
"avg": true,
"current": false,
"max": true,
"min": true,
"rightSide": false,
"show": true,
"sort": "avg",
"sortDesc": true,
"total": false,
"values": true
},
"lines": true,
"linewidth": 2,
"links": [],
"nullPointMode": "null",
"paceLength": 10,
"percentage": false,
"pointradius": 5,
"points": false,
"renderer": "flot",
"seriesOverrides": [],
"spaceLength": 10,
"stack": false,
"steppedLine": false,
"targets": [
{
"calculatedInterval": "2m",
"datasourceErrors": {},
"errors": {},
"expr": "mysql_global_status_open_files{instance=\"$host\"}",
"interval": "$interval",
"intervalFactor": 1,
"legendFormat": "Open Files",
"metric": "",
"refId": "A",
"step": 20
},
{
"calculatedInterval": "2m",
"datasourceErrors": {},
"errors": {},
"expr": "mysql_global_variables_open_files_limit{instance=\"$host\"}",
"interval": "$interval",
"intervalFactor": 1,
"legendFormat": "Open Files Limit",
"metric": "",
"refId": "D",
"step": 20
},
{
"expr": "mysql_global_status_innodb_num_open_files{instance=\"$host\"}",
"interval": "$interval",
"intervalFactor": 1,
"legendFormat": "InnoDB Open Files",
"refId": "B",
"step": 20
}
],
"thresholds": [],
"timeFrom": null,
"timeRegions": [],
"timeShift": null,
"title": "MySQL Open Files",
"tooltip": {
"msResolution": false,
"shared": true,
"sort": 0,
"value_type": "individual"
},
"type": "graph",
"xaxis": {
"buckets": null,
"mode": "time",
"name": null,
"show": true,
"values": []
},
"yaxes": [
{
"format": "short",
"logBase": 1,
"max": null,
"min": 0,
"show": true
},
{
"format": "short",
"logBase": 1,
"max": null,
"min": 0,
"show": true
}
],
"yaxis": {
"align": false,
"alignLevel": null
}
},
{
"collapsed": false,
"datasource": null,
"gridPos": {
"h": 1,
"w": 24,
"x": 0,
"y": 118
},
"id": 393,
"panels": [],
"repeat": null,
"title": "Table Openings",
"type": "row"
},
{
"aliasColors": {},
"bars": false,
"dashLength": 10,
"dashes": false,
"datasource": "Prometheus",
"decimals": 2,
"description": "**MySQL Table Open Cache Status**\n\nThe recommendation is to set the `table_open_cache_instances` to a loose correlation to virtual CPUs, keeping in mind that more instances means the cache is split more times. If you have a cache set to 500 but it has 10 instances, each cache will only have 50 cached.\n\nThe `table_definition_cache` and `table_open_cache` can be left as default as they are auto-sized MySQL 5.6 and above (ie: do not set them to any value).",
"editable": true,
"error": false,
"fieldConfig": {
"defaults": {
"custom": {}
},
"overrides": []
},
"fill": 2,
"grid": {},
"gridPos": {
"h": 7,
"w": 12,
"x": 0,
"y": 119
},
"id": 44,
"legend": {
"alignAsTable": true,
"avg": true,
"current": false,
"max": true,
"min": true,
"rightSide": false,
"show": true,
"sort": "avg",
"sortDesc": true,
"total": false,
"values": true
},
"lines": true,
"linewidth": 2,
"links": [
{
"title": "Server Status Variables (table_open_cache)",
"url": "http://dev.mysql.com/doc/refman/5.6/en/server-system-variables.html#sysvar_table_open_cache"
}
],
"nullPointMode": "null",
"paceLength": 10,
"percentage": false,
"pointradius": 5,
"points": false,
"renderer": "flot",
"seriesOverrides": [
{
"alias": "Table Open Cache Hit Ratio",
"yaxis": 2
}
],
"spaceLength": 10,
"stack": false,
"steppedLine": false,
"targets": [
{
"calculatedInterval": "2m",
"datasourceErrors": {},
"errors": {},
"expr": "rate(mysql_global_status_opened_tables{instance=\"$host\"}[$interval]) or irate(mysql_global_status_opened_tables{instance=\"$host\"}[5m])",
"format": "time_series",
"interval": "$interval",
"intervalFactor": 1,
"legendFormat": "Openings",
"metric": "",
"refId": "A",
"step": 20
},
{
"expr": "rate(mysql_global_status_table_open_cache_hits{instance=\"$host\"}[$interval]) or irate(mysql_global_status_table_open_cache_hits{instance=\"$host\"}[5m])",
"format": "time_series",
"interval": "$interval",
"intervalFactor": 1,
"legendFormat": "Hits",
"refId": "B",
"step": 20
},
{
"expr": "rate(mysql_global_status_table_open_cache_misses{instance=\"$host\"}[$interval]) or irate(mysql_global_status_table_open_cache_misses{instance=\"$host\"}[5m])",
"format": "time_series",
"interval": "$interval",
"intervalFactor": 1,
"legendFormat": "Misses",
"refId": "C",
"step": 20
},
{
"expr": "rate(mysql_global_status_table_open_cache_overflows{instance=\"$host\"}[$interval]) or irate(mysql_global_status_table_open_cache_overflows{instance=\"$host\"}[5m])",
"format": "time_series",
"interval": "$interval",
"intervalFactor": 1,
"legendFormat": "Misses due to Overflows",
"refId": "D",
"step": 20
},
{
"expr": "(rate(mysql_global_status_table_open_cache_hits{instance=\"$host\"}[$interval]) or irate(mysql_global_status_table_open_cache_hits{instance=\"$host\"}[5m]))/((rate(mysql_global_status_table_open_cache_hits{instance=\"$host\"}[$interval]) or irate(mysql_global_status_table_open_cache_hits{instance=\"$host\"}[5m]))+(rate(mysql_global_status_table_open_cache_misses{instance=\"$host\"}[$interval]) or irate(mysql_global_status_table_open_cache_misses{instance=\"$host\"}[5m])))",
"format": "time_series",
"interval": "$interval",
"intervalFactor": 1,
"legendFormat": "Table Open Cache Hit Ratio",
"refId": "E",
"step": 20
}
],
"thresholds": [],
"timeFrom": null,
"timeRegions": [],
"timeShift": null,
"title": "MySQL Table Open Cache Status",
"tooltip": {
"msResolution": false,
"shared": true,
"sort": 0,
"value_type": "individual"
},
"type": "graph",
"xaxis": {
"buckets": null,
"mode": "time",
"name": null,
"show": true,
"values": []
},
"yaxes": [
{
"format": "short",
"logBase": 1,
"max": null,
"min": 0,
"show": true
},
{
"format": "percentunit",
"logBase": 1,
"max": null,
"min": 0,
"show": true
}
],
"yaxis": {
"align": false,
"alignLevel": null
}
},
{
"aliasColors": {},
"bars": false,
"dashLength": 10,
"dashes": false,
"datasource": "Prometheus",
"decimals": 2,
"description": "**MySQL Open Tables**\n\nThe recommendation is to set the `table_open_cache_instances` to a loose correlation to virtual CPUs, keeping in mind that more instances means the cache is split more times. If you have a cache set to 500 but it has 10 instances, each cache will only have 50 cached.\n\nThe `table_definition_cache` and `table_open_cache` can be left as default as they are auto-sized MySQL 5.6 and above (ie: do not set them to any value).",
"editable": true,
"error": false,
"fieldConfig": {
"defaults": {
"custom": {}
},
"overrides": []
},
"fill": 2,
"grid": {},
"gridPos": {
"h": 7,
"w": 12,
"x": 12,
"y": 119
},
"id": 42,
"legend": {
"alignAsTable": true,
"avg": true,
"current": false,
"max": true,
"min": true,
"rightSide": false,
"show": true,
"sort": "avg",
"sortDesc": true,
"total": false,
"values": true
},
"lines": true,
"linewidth": 2,
"links": [
{
"title": "Server Status Variables (table_open_cache)",
"url": "http://dev.mysql.com/doc/refman/5.6/en/server-system-variables.html#sysvar_table_open_cache"
}
],
"nullPointMode": "null",
"paceLength": 10,
"percentage": false,
"pointradius": 5,
"points": false,
"renderer": "flot",
"seriesOverrides": [],
"spaceLength": 10,
"stack": false,
"steppedLine": false,
"targets": [
{
"calculatedInterval": "2m",
"datasourceErrors": {},
"errors": {},
"expr": "mysql_global_status_open_tables{instance=\"$host\"}",
"format": "time_series",
"interval": "$interval",
"intervalFactor": 1,
"legendFormat": "Open Tables",
"metric": "",
"refId": "B",
"step": 20
},
{
"calculatedInterval": "2m",
"datasourceErrors": {},
"errors": {},
"expr": "mysql_global_variables_table_open_cache{instance=\"$host\"}",
"format": "time_series",
"interval": "$interval",
"intervalFactor": 1,
"legendFormat": "Table Open Cache",
"metric": "",
"refId": "C",
"step": 20
}
],
"thresholds": [],
"timeFrom": null,
"timeRegions": [],
"timeShift": null,
"title": "MySQL Open Tables",
"tooltip": {
"msResolution": false,
"shared": true,
"sort": 0,
"value_type": "individual"
},
"type": "graph",
"xaxis": {
"buckets": null,
"mode": "time",
"name": null,
"show": true,
"values": []
},
"yaxes": [
{
"format": "short",
"logBase": 1,
"max": null,
"min": 0,
"show": true
},
{
"format": "short",
"logBase": 1,
"max": null,
"min": 0,
"show": true
}
],
"yaxis": {
"align": false,
"alignLevel": null
}
},
{
"collapsed": true,
"datasource": null,
"gridPos": {
"h": 1,
"w": 24,
"x": 0,
"y": 126
},
"id": 394,
"panels": [
{
"aliasColors": {},
"bars": false,
"dashLength": 10,
"dashes": false,
"datasource": "Prometheus",
"decimals": 2,
"description": "**MySQL Table Definition Cache**\n\nThe recommendation is to set the `table_open_cache_instances` to a loose correlation to virtual CPUs, keeping in mind that more instances means the cache is split more times. If you have a cache set to 500 but it has 10 instances, each cache will only have 50 cached.\n\nThe `table_definition_cache` and `table_open_cache` can be left as default as they are auto-sized MySQL 5.6 and above (ie: do not set them to any value).",
"editable": true,
"error": false,
"fill": 2,
"grid": {},
"gridPos": {
"h": 7,
"w": 24,
"x": 0,
"y": 127
},
"id": 54,
"legend": {
"alignAsTable": true,
"avg": true,
"current": false,
"max": true,
"min": true,
"rightSide": false,
"show": true,
"sort": "avg",
"sortDesc": true,
"total": false,
"values": true
},
"lines": true,
"linewidth": 2,
"links": [
{
"title": "Server Status Variables (table_open_cache)",
"url": "http://dev.mysql.com/doc/refman/5.6/en/server-system-variables.html#sysvar_table_open_cache"
}
],
"nullPointMode": "null",
"options": {},
"paceLength": 10,
"percentage": false,
"pointradius": 5,
"points": false,
"renderer": "flot",
"seriesOverrides": [
{
"alias": "Opened Table Definitions",
"yaxis": 2
}
],
"spaceLength": 10,
"stack": false,
"steppedLine": false,
"targets": [
{
"calculatedInterval": "2m",
"datasourceErrors": {},
"errors": {},
"expr": "mysql_global_status_open_table_definitions{instance=\"$host\"}",
"format": "time_series",
"interval": "$interval",
"intervalFactor": 1,
"legendFormat": "Open Table Definitions",
"metric": "",
"refId": "B",
"step": 20
},
{
"calculatedInterval": "2m",
"datasourceErrors": {},
"errors": {},
"expr": "mysql_global_variables_table_definition_cache{instance=\"$host\"}",
"format": "time_series",
"interval": "$interval",
"intervalFactor": 1,
"legendFormat": "Table Definitions Cache Size",
"metric": "",
"refId": "C",
"step": 20
},
{
"expr": "rate(mysql_global_status_opened_table_definitions{instance=\"$host\"}[$interval]) or irate(mysql_global_status_opened_table_definitions{instance=\"$host\"}[5m])",
"format": "time_series",
"interval": "$interval",
"intervalFactor": 1,
"legendFormat": "Opened Table Definitions",
"refId": "A",
"step": 20
}
],
"thresholds": [],
"timeFrom": null,
"timeRegions": [],
"timeShift": null,
"title": "MySQL Table Definition Cache",
"tooltip": {
"msResolution": false,
"shared": true,
"sort": 0,
"value_type": "individual"
},
"type": "graph",
"xaxis": {
"buckets": null,
"mode": "time",
"name": null,
"show": true,
"values": []
},
"yaxes": [
{
"format": "short",
"logBase": 1,
"max": null,
"min": 0,
"show": true
},
{
"format": "short",
"logBase": 1,
"max": null,
"min": 0,
"show": true
}
],
"yaxis": {
"align": false,
"alignLevel": null
}
}
],
"repeat": null,
"title": "MySQL Table Definition Cache",
"type": "row"
},
{
"collapsed": true,
"datasource": null,
"gridPos": {
"h": 1,
"w": 24,
"x": 0,
"y": 127
},
"id": 395,
"panels": [
{
"aliasColors": {},
"bars": false,
"dashLength": 10,
"dashes": false,
"datasource": "Prometheus",
"decimals": 2,
"editable": true,
"error": false,
"fill": 2,
"grid": {},
"gridPos": {
"h": 7,
"w": 12,
"x": 0,
"y": 135
},
"id": 31,
"legend": {
"alignAsTable": true,
"avg": true,
"current": false,
"hideEmpty": false,
"max": true,
"min": true,
"rightSide": false,
"show": true,
"sort": "avg",
"sortDesc": true,
"total": false,
"values": true
},
"lines": true,
"linewidth": 2,
"links": [],
"nullPointMode": "null",
"options": {},
"paceLength": 10,
"percentage": false,
"pointradius": 5,
"points": false,
"renderer": "flot",
"seriesOverrides": [],
"spaceLength": 10,
"stack": false,
"steppedLine": false,
"targets": [
{
"calculatedInterval": "2s",
"datasourceErrors": {},
"errors": {},
"expr": "rate(node_vmstat_pgpgin{instance=\"$host\"}[$interval]) * 1024 or irate(node_vmstat_pgpgin{instance=\"$host\"}[5m]) * 1024",
"format": "time_series",
"interval": "$interval",
"intervalFactor": 1,
"legendFormat": "Page In",
"metric": "",
"refId": "A",
"step": 20,
"target": ""
},
{
"calculatedInterval": "2s",
"datasourceErrors": {},
"errors": {},
"expr": "rate(node_vmstat_pgpgout{instance=\"$host\"}[$interval]) * 1024 or irate(node_vmstat_pgpgout{instance=\"$host\"}[5m]) * 1024",
"format": "time_series",
"interval": "$interval",
"intervalFactor": 1,
"legendFormat": "Page Out",
"metric": "",
"refId": "B",
"step": 20,
"target": ""
}
],
"thresholds": [],
"timeFrom": null,
"timeRegions": [],
"timeShift": null,
"title": "I/O Activity",
"tooltip": {
"msResolution": false,
"shared": true,
"sort": 0,
"value_type": "individual"
},
"type": "graph",
"xaxis": {
"buckets": null,
"mode": "time",
"name": null,
"show": true,
"values": []
},
"yaxes": [
{
"format": "Bps",
"label": "",
"logBase": 1,
"max": null,
"min": 0,
"show": true
},
{
"format": "bytes",
"logBase": 1,
"max": null,
"min": 0,
"show": true
}
],
"yaxis": {
"align": false,
"alignLevel": null
}
},
{
"aliasColors": {},
"bars": false,
"dashLength": 10,
"dashes": false,
"datasource": "Prometheus",
"decimals": null,
"editable": true,
"error": false,
"fill": 6,
"grid": {},
"gridPos": {
"h": 7,
"w": 12,
"x": 12,
"y": 135
},
"height": "250px",
"id": 37,
"legend": {
"alignAsTable": true,
"avg": true,
"current": false,
"hideEmpty": false,
"max": true,
"min": true,
"rightSide": false,
"show": true,
"sort": "avg",
"sortDesc": true,
"total": false,
"values": true
},
"lines": true,
"linewidth": 2,
"links": [],
"nullPointMode": "null",
"options": {},
"paceLength": 10,
"percentage": false,
"pointradius": 5,
"points": false,
"renderer": "flot",
"seriesOverrides": [],
"spaceLength": 10,
"stack": true,
"steppedLine": false,
"targets": [
{
"calculatedInterval": "2s",
"datasourceErrors": {},
"errors": {},
"expr": "max(node_memory_MemTotal{instance=\"$host\"}) without(job) - \n(max(node_memory_MemFree{instance=\"$host\"}) without(job) + \nmax(node_memory_Buffers{instance=\"$host\"}) without(job) + \n(max(node_memory_Cached{instance=\"$host\",job=~\"rds-enhanced|linux\"}) without (job) or \nmax(node_memory_Cached{instance=\"$host\",job=\"rds-basic\"}) without (job)))",
"format": "time_series",
"interval": "$interval",
"intervalFactor": 1,
"legendFormat": "Used",
"metric": "",
"refId": "A",
"step": 20,
"target": ""
},
{
"calculatedInterval": "2s",
"datasourceErrors": {},
"errors": {},
"expr": "node_memory_MemFree{instance=\"$host\"}",
"format": "time_series",
"interval": "$interval",
"intervalFactor": 1,
"legendFormat": "Free",
"metric": "",
"refId": "B",
"step": 20,
"target": ""
},
{
"calculatedInterval": "2s",
"datasourceErrors": {},
"errors": {},
"expr": "node_memory_Buffers{instance=\"$host\"}",
"format": "time_series",
"interval": "$interval",
"intervalFactor": 1,
"legendFormat": "Buffers",
"metric": "",
"refId": "D",
"step": 20,
"target": ""
},
{
"calculatedInterval": "2s",
"datasourceErrors": {},
"errors": {},
"expr": "max(node_memory_Cached{instance=~\"$host\",job=~\"rds-enhanced|linux\"}) without (job) or \nmax(node_memory_Cached{instance=~\"$host\",job=~\"rds-basic\"}) without (job)",
"format": "time_series",
"interval": "$interval",
"intervalFactor": 1,
"legendFormat": "Cached",
"metric": "",
"refId": "E",
"step": 20,
"target": ""
}
],
"thresholds": [],
"timeFrom": null,
"timeRegions": [],
"timeShift": null,
"title": "Memory Distribution",
"tooltip": {
"msResolution": false,
"shared": true,
"sort": 0,
"value_type": "individual"
},
"type": "graph",
"xaxis": {
"buckets": null,
"mode": "time",
"name": null,
"show": true,
"values": []
},
"yaxes": [
{
"format": "bytes",
"label": "",
"logBase": 1,
"max": null,
"min": 0,
"show": true
},
{
"format": "bytes",
"logBase": 1,
"max": null,
"min": 0,
"show": false
}
],
"yaxis": {
"align": false,
"alignLevel": null
}
},
{
"aliasColors": {
"Load 1m": "#58140C",
"Max Core Utilization": "#bf1b00",
"iowait": "#e24d42",
"nice": "#1f78c1",
"softirq": "#806eb7",
"system": "#eab839",
"user": "#508642"
},
"bars": false,
"dashLength": 10,
"dashes": false,
"datasource": "Prometheus",
"decimals": null,
"editable": true,
"error": false,
"fill": 6,
"grid": {},
"gridPos": {
"h": 7,
"w": 12,
"x": 0,
"y": 142
},
"height": "",
"id": 2,
"legend": {
"alignAsTable": true,
"avg": true,
"current": false,
"hideEmpty": true,
"hideZero": true,
"max": true,
"min": true,
"rightSide": true,
"show": true,
"sort": "avg",
"sortDesc": true,
"total": false,
"values": true
},
"lines": true,
"linewidth": 2,
"links": [],
"nullPointMode": "null",
"options": {},
"paceLength": 10,
"percentage": false,
"pointradius": 5,
"points": false,
"renderer": "flot",
"seriesOverrides": [
{
"alias": "Max Core Utilization",
"lines": false,
"pointradius": 1,
"points": true,
"stack": false
},
{
"alias": "Load 1m",
"color": "#58140C",
"fill": 2,
"legend": false,
"stack": false,
"yaxis": 2
}
],
"spaceLength": 10,
"stack": true,
"steppedLine": false,
"targets": [
{
"calculatedInterval": "2s",
"datasourceErrors": {},
"errors": {},
"expr": "clamp_max(((avg by (mode) ( (clamp_max(rate(node_cpu{instance=\"$host\",mode!=\"idle\"}[$interval]),1)) or (clamp_max(irate(node_cpu{instance=\"$host\",mode!=\"idle\"}[5m]),1)) ))*100 or (avg_over_time(node_cpu_average{instance=~\"$host\", mode!=\"total\", mode!=\"idle\"}[$interval]) or avg_over_time(node_cpu_average{instance=~\"$host\", mode!=\"total\", mode!=\"idle\"}[5m]))),100)",
"format": "time_series",
"hide": false,
"interval": "$interval",
"intervalFactor": 1,
"legendFormat": "{{ mode }}",
"metric": "",
"refId": "A",
"step": 20
},
{
"expr": "clamp_max(max by () (sum by (cpu) ( (clamp_max(rate(node_cpu{instance=\"$host\",mode!=\"idle\",mode!=\"iowait\"}[$interval]),1)) or (clamp_max(irate(node_cpu{instance=\"$host\",mode!=\"idle\",mode!=\"iowait\"}[5m]),1)) ))*100,100)",
"format": "time_series",
"hide": true,
"interval": "$interval",
"intervalFactor": 1,
"legendFormat": "Max Core Utilization",
"refId": "B",
"step": 20
},
{
"expr": "node_load1{instance=\"$host\"}",
"format": "time_series",
"hide": false,
"intervalFactor": 2,
"legendFormat": "Load 1m",
"refId": "C"
}
],
"thresholds": [],
"timeFrom": null,
"timeRegions": [],
"timeShift": null,
"title": "CPU Usage / Load",
"tooltip": {
"msResolution": false,
"shared": true,
"sort": 0,
"value_type": "individual"
},
"type": "graph",
"xaxis": {
"buckets": null,
"mode": "time",
"name": null,
"show": true,
"values": []
},
"yaxes": [
{
"decimals": 1,
"format": "percent",
"label": "",
"logBase": 1,
"max": 100,
"min": 0,
"show": true
},
{
"format": "none",
"logBase": 1,
"max": null,
"min": 0,
"show": true
}
],
"yaxis": {
"align": false,
"alignLevel": null
}
},
{
"aliasColors": {},
"bars": false,
"dashLength": 10,
"dashes": false,
"datasource": "Prometheus",
"decimals": 2,
"editable": true,
"error": false,
"fill": 2,
"grid": {},
"gridPos": {
"h": 7,
"w": 12,
"x": 12,
"y": 142
},
"height": "250px",
"id": 36,
"legend": {
"alignAsTable": true,
"avg": true,
"current": false,
"hideEmpty": true,
"hideZero": true,
"max": true,
"min": true,
"rightSide": false,
"show": true,
"sort": "avg",
"sortDesc": true,
"total": false,
"values": true
},
"lines": false,
"linewidth": 2,
"links": [],
"nullPointMode": "null",
"options": {},
"paceLength": 10,
"percentage": false,
"pointradius": 1,
"points": true,
"renderer": "flot",
"seriesOverrides": [],
"spaceLength": 10,
"stack": false,
"steppedLine": false,
"targets": [
{
"calculatedInterval": "2m",
"datasourceErrors": {},
"errors": {},
"expr": "sum((rate(node_disk_read_time_ms{device!~\"dm-.+\", instance=\"$host\"}[$interval]) / rate(node_disk_reads_completed{device!~\"dm-.+\", instance=\"$host\"}[$interval])) or (irate(node_disk_read_time_ms{device!~\"dm-.+\", instance=\"$host\"}[5m]) / irate(node_disk_reads_completed{device!~\"dm-.+\", instance=\"$host\"}[5m]))\nor avg_over_time(aws_rds_read_latency_average{instance=\"$host\"}[$interval]) or avg_over_time(aws_rds_read_latency_average{instance=\"$host\"}[5m]))",
"format": "time_series",
"interval": "$interval",
"intervalFactor": 1,
"legendFormat": "Read",
"metric": "",
"refId": "A",
"step": 20,
"target": ""
},
{
"calculatedInterval": "2m",
"datasourceErrors": {},
"errors": {},
"expr": "sum((rate(node_disk_write_time_ms{device!~\"dm-.+\", instance=\"$host\"}[$interval]) / rate(node_disk_writes_completed{device!~\"dm-.+\", instance=\"$host\"}[$interval])) or (irate(node_disk_write_time_ms{device!~\"dm-.+\", instance=\"$host\"}[5m]) / irate(node_disk_writes_completed{device!~\"dm-.+\", instance=\"$host\"}[5m])) or \navg_over_time(aws_rds_write_latency_average{instance=\"$host\"}[$interval]) or avg_over_time(aws_rds_write_latency_average{instance=\"$host\"}[5m]))",
"format": "time_series",
"interval": "$interval",
"intervalFactor": 1,
"legendFormat": "Write",
"metric": "",
"refId": "B",
"step": 20,
"target": ""
}
],
"thresholds": [],
"timeFrom": null,
"timeRegions": [],
"timeShift": null,
"title": "Disk Latency",
"tooltip": {
"msResolution": false,
"shared": true,
"sort": 0,
"value_type": "individual"
},
"type": "graph",
"xaxis": {
"buckets": null,
"mode": "time",
"name": null,
"show": true,
"values": []
},
"yaxes": [
{
"format": "ms",
"label": "",
"logBase": 2,
"max": null,
"min": null,
"show": true
},
{
"format": "ms",
"label": "",
"logBase": 1,
"max": null,
"min": 0,
"show": true
}
],
"yaxis": {
"align": false,
"alignLevel": null
}
},
{
"aliasColors": {},
"bars": false,
"dashLength": 10,
"dashes": false,
"datasource": "Prometheus",
"decimals": null,
"editable": true,
"error": false,
"fill": 2,
"grid": {},
"gridPos": {
"h": 7,
"w": 12,
"x": 0,
"y": 149
},
"height": "250px",
"id": 21,
"legend": {
"alignAsTable": true,
"avg": true,
"current": false,
"hideEmpty": false,
"max": true,
"min": true,
"rightSide": false,
"show": true,
"sort": "avg",
"sortDesc": true,
"total": false,
"values": true
},
"lines": true,
"linewidth": 2,
"links": [],
"nullPointMode": "null",
"options": {},
"paceLength": 10,
"percentage": false,
"pointradius": 5,
"points": false,
"renderer": "flot",
"seriesOverrides": [
{
"alias": "Outbound",
"transform": "negative-Y"
}
],
"spaceLength": 10,
"stack": false,
"steppedLine": false,
"targets": [
{
"calculatedInterval": "2s",
"datasourceErrors": {},
"errors": {},
"expr": "sum(rate(node_network_receive_bytes{instance=\"$host\", device!=\"lo\"}[$interval])) or sum(irate(node_network_receive_bytes{instance=\"$host\", device!=\"lo\"}[5m])) or sum(max_over_time(rdsosmetrics_network_rx{instance=\"$host\"}[$interval])) or sum(max_over_time(rdsosmetrics_network_rx{instance=\"$host\"}[5m])) ",
"format": "time_series",
"interval": "$interval",
"intervalFactor": 1,
"legendFormat": "Inbound",
"metric": "",
"refId": "B",
"step": 20,
"target": ""
},
{
"calculatedInterval": "2s",
"datasourceErrors": {},
"errors": {},
"expr": "sum(rate(node_network_transmit_bytes{instance=\"$host\", device!=\"lo\"}[$interval])) or sum(irate(node_network_transmit_bytes{instance=\"$host\", device!=\"lo\"}[5m])) or\nsum(max_over_time(rdsosmetrics_network_tx{instance=\"$host\"}[$interval])) or sum(max_over_time(rdsosmetrics_network_tx{instance=\"$host\"}[5m]))",
"format": "time_series",
"interval": "$interval",
"intervalFactor": 1,
"legendFormat": "Outbound",
"metric": "",
"refId": "A",
"step": 20,
"target": ""
}
],
"thresholds": [],
"timeFrom": null,
"timeRegions": [],
"timeShift": null,
"title": "Network Traffic",
"tooltip": {
"msResolution": false,
"shared": true,
"sort": 0,
"value_type": "individual"
},
"type": "graph",
"xaxis": {
"buckets": null,
"mode": "time",
"name": null,
"show": true,
"values": []
},
"yaxes": [
{
"format": "Bps",
"label": "Outbound (-) / Inbound (+)",
"logBase": 1,
"max": null,
"min": null,
"show": true
},
{
"format": "bytes",
"logBase": 1,
"max": null,
"min": 0,
"show": false
}
],
"yaxis": {
"align": false,
"alignLevel": null
}
},
{
"aliasColors": {},
"bars": false,
"dashLength": 10,
"dashes": false,
"datasource": "Prometheus",
"decimals": null,
"editable": true,
"error": false,
"fill": 2,
"grid": {},
"gridPos": {
"h": 7,
"w": 12,
"x": 12,
"y": 149
},
"id": 38,
"legend": {
"alignAsTable": true,
"avg": true,
"current": false,
"hideEmpty": false,
"max": true,
"min": true,
"rightSide": false,
"show": true,
"sort": "avg",
"sortDesc": true,
"total": false,
"values": true
},
"lines": true,
"linewidth": 2,
"links": [],
"nullPointMode": "null",
"options": {},
"paceLength": 10,
"percentage": false,
"pointradius": 5,
"points": false,
"renderer": "flot",
"seriesOverrides": [],
"spaceLength": 10,
"stack": false,
"steppedLine": false,
"targets": [
{
"calculatedInterval": "2s",
"datasourceErrors": {},
"errors": {},
"expr": "rate(node_vmstat_pswpin{instance=\"$host\"}[$interval]) * 4096 or irate(node_vmstat_pswpin{instance=\"$host\"}[5m]) * 4096",
"format": "time_series",
"interval": "$interval",
"intervalFactor": 1,
"legendFormat": "Swap In (Reads)",
"metric": "",
"refId": "A",
"step": 20,
"target": ""
},
{
"calculatedInterval": "2s",
"datasourceErrors": {},
"errors": {},
"expr": "rate(node_vmstat_pswpout{instance=\"$host\"}[$interval]) * 4096 or irate(node_vmstat_pswpout{instance=\"$host\"}[5m]) * 4096",
"format": "time_series",
"interval": "$interval",
"intervalFactor": 1,
"legendFormat": "Swap Out (Writes)",
"metric": "",
"refId": "B",
"step": 20,
"target": ""
}
],
"thresholds": [],
"timeFrom": null,
"timeRegions": [],
"timeShift": null,
"title": "Swap Activity",
"tooltip": {
"msResolution": false,
"shared": true,
"sort": 0,
"value_type": "individual"
},
"type": "graph",
"xaxis": {
"buckets": null,
"mode": "time",
"name": null,
"show": true,
"values": []
},
"yaxes": [
{
"format": "Bps",
"label": "",
"logBase": 1,
"max": null,
"min": 0,
"show": true
},
{
"format": "bytes",
"logBase": 1,
"max": null,
"min": 0,
"show": true
}
],
"yaxis": {
"align": false,
"alignLevel": null
}
}
],
"repeat": null,
"title": "System Charts",
"type": "row"
}
],
"refresh": "1m",
"schemaVersion": 25,
"style": "dark",
"tags": [
"Percona",
"MySQL",
"mysqldb"
],
"templating": {
"list": [
{
"allFormat": "glob",
"auto": true,
"auto_count": 200,
"auto_min": "1s",
"current": {
"selected": false,
"text": "auto",
"value": "$__auto_interval_interval"
},
"datasource": "Prometheus",
"hide": 0,
"includeAll": false,
"label": "Interval",
"multi": false,
"multiFormat": "glob",
"name": "interval",
"options": [
{
"selected": true,
"text": "auto",
"value": "$__auto_interval_interval"
},
{
"selected": false,
"text": "1s",
"value": "1s"
},
{
"selected": false,
"text": "5s",
"value": "5s"
},
{
"selected": false,
"text": "1m",
"value": "1m"
},
{
"selected": false,
"text": "5m",
"value": "5m"
},
{
"selected": false,
"text": "1h",
"value": "1h"
},
{
"selected": false,
"text": "6h",
"value": "6h"
},
{
"selected": false,
"text": "1d",
"value": "1d"
}
],
"query": "1s,5s,1m,5m,1h,6h,1d",
"refresh": 2,
"skipUrlSync": false,
"type": "interval"
},
{
"allFormat": "glob",
"allValue": null,
"current": {
"selected": false,
"text": "mysql-exporter-prometheus-mysql-exporter.monitoring:9104",
"value": "mysql-exporter-prometheus-mysql-exporter.monitoring:9104"
},
"datasource": "Prometheus",
"definition": "",
"hide": 0,
"includeAll": false,
"label": "Host",
"multi": false,
"multiFormat": "regex values",
"name": "host",
"options": [],
"query": "label_values(mysql_up, instance)",
"refresh": 1,
"refresh_on_load": false,
"regex": "",
"skipUrlSync": false,
"sort": 1,
"tagValuesQuery": null,
"tags": [],
"tagsQuery": null,
"type": "query",
"useTags": false
}
]
},
"time": {
"from": "now-12h",
"to": "now"
},
"timepicker": {
"collapse": false,
"enable": true,
"hidden": false,
"notice": false,
"now": true,
"refresh_intervals": [
"10s",
"30s",
"1m",
"5m",
"15m",
"30m",
"1h",
"2h",
"1d"
],
"status": "Stable",
"time_options": [
"5m",
"15m",
"1h",
"6h",
"12h",
"24h",
"2d",
"7d",
"30d"
],
"type": "timepicker"
},
"timezone": "browser",
"title": "MySQL Overview",
"uid": "MQWgroiiz",
"version": 1
}
oracle view 效果展示:
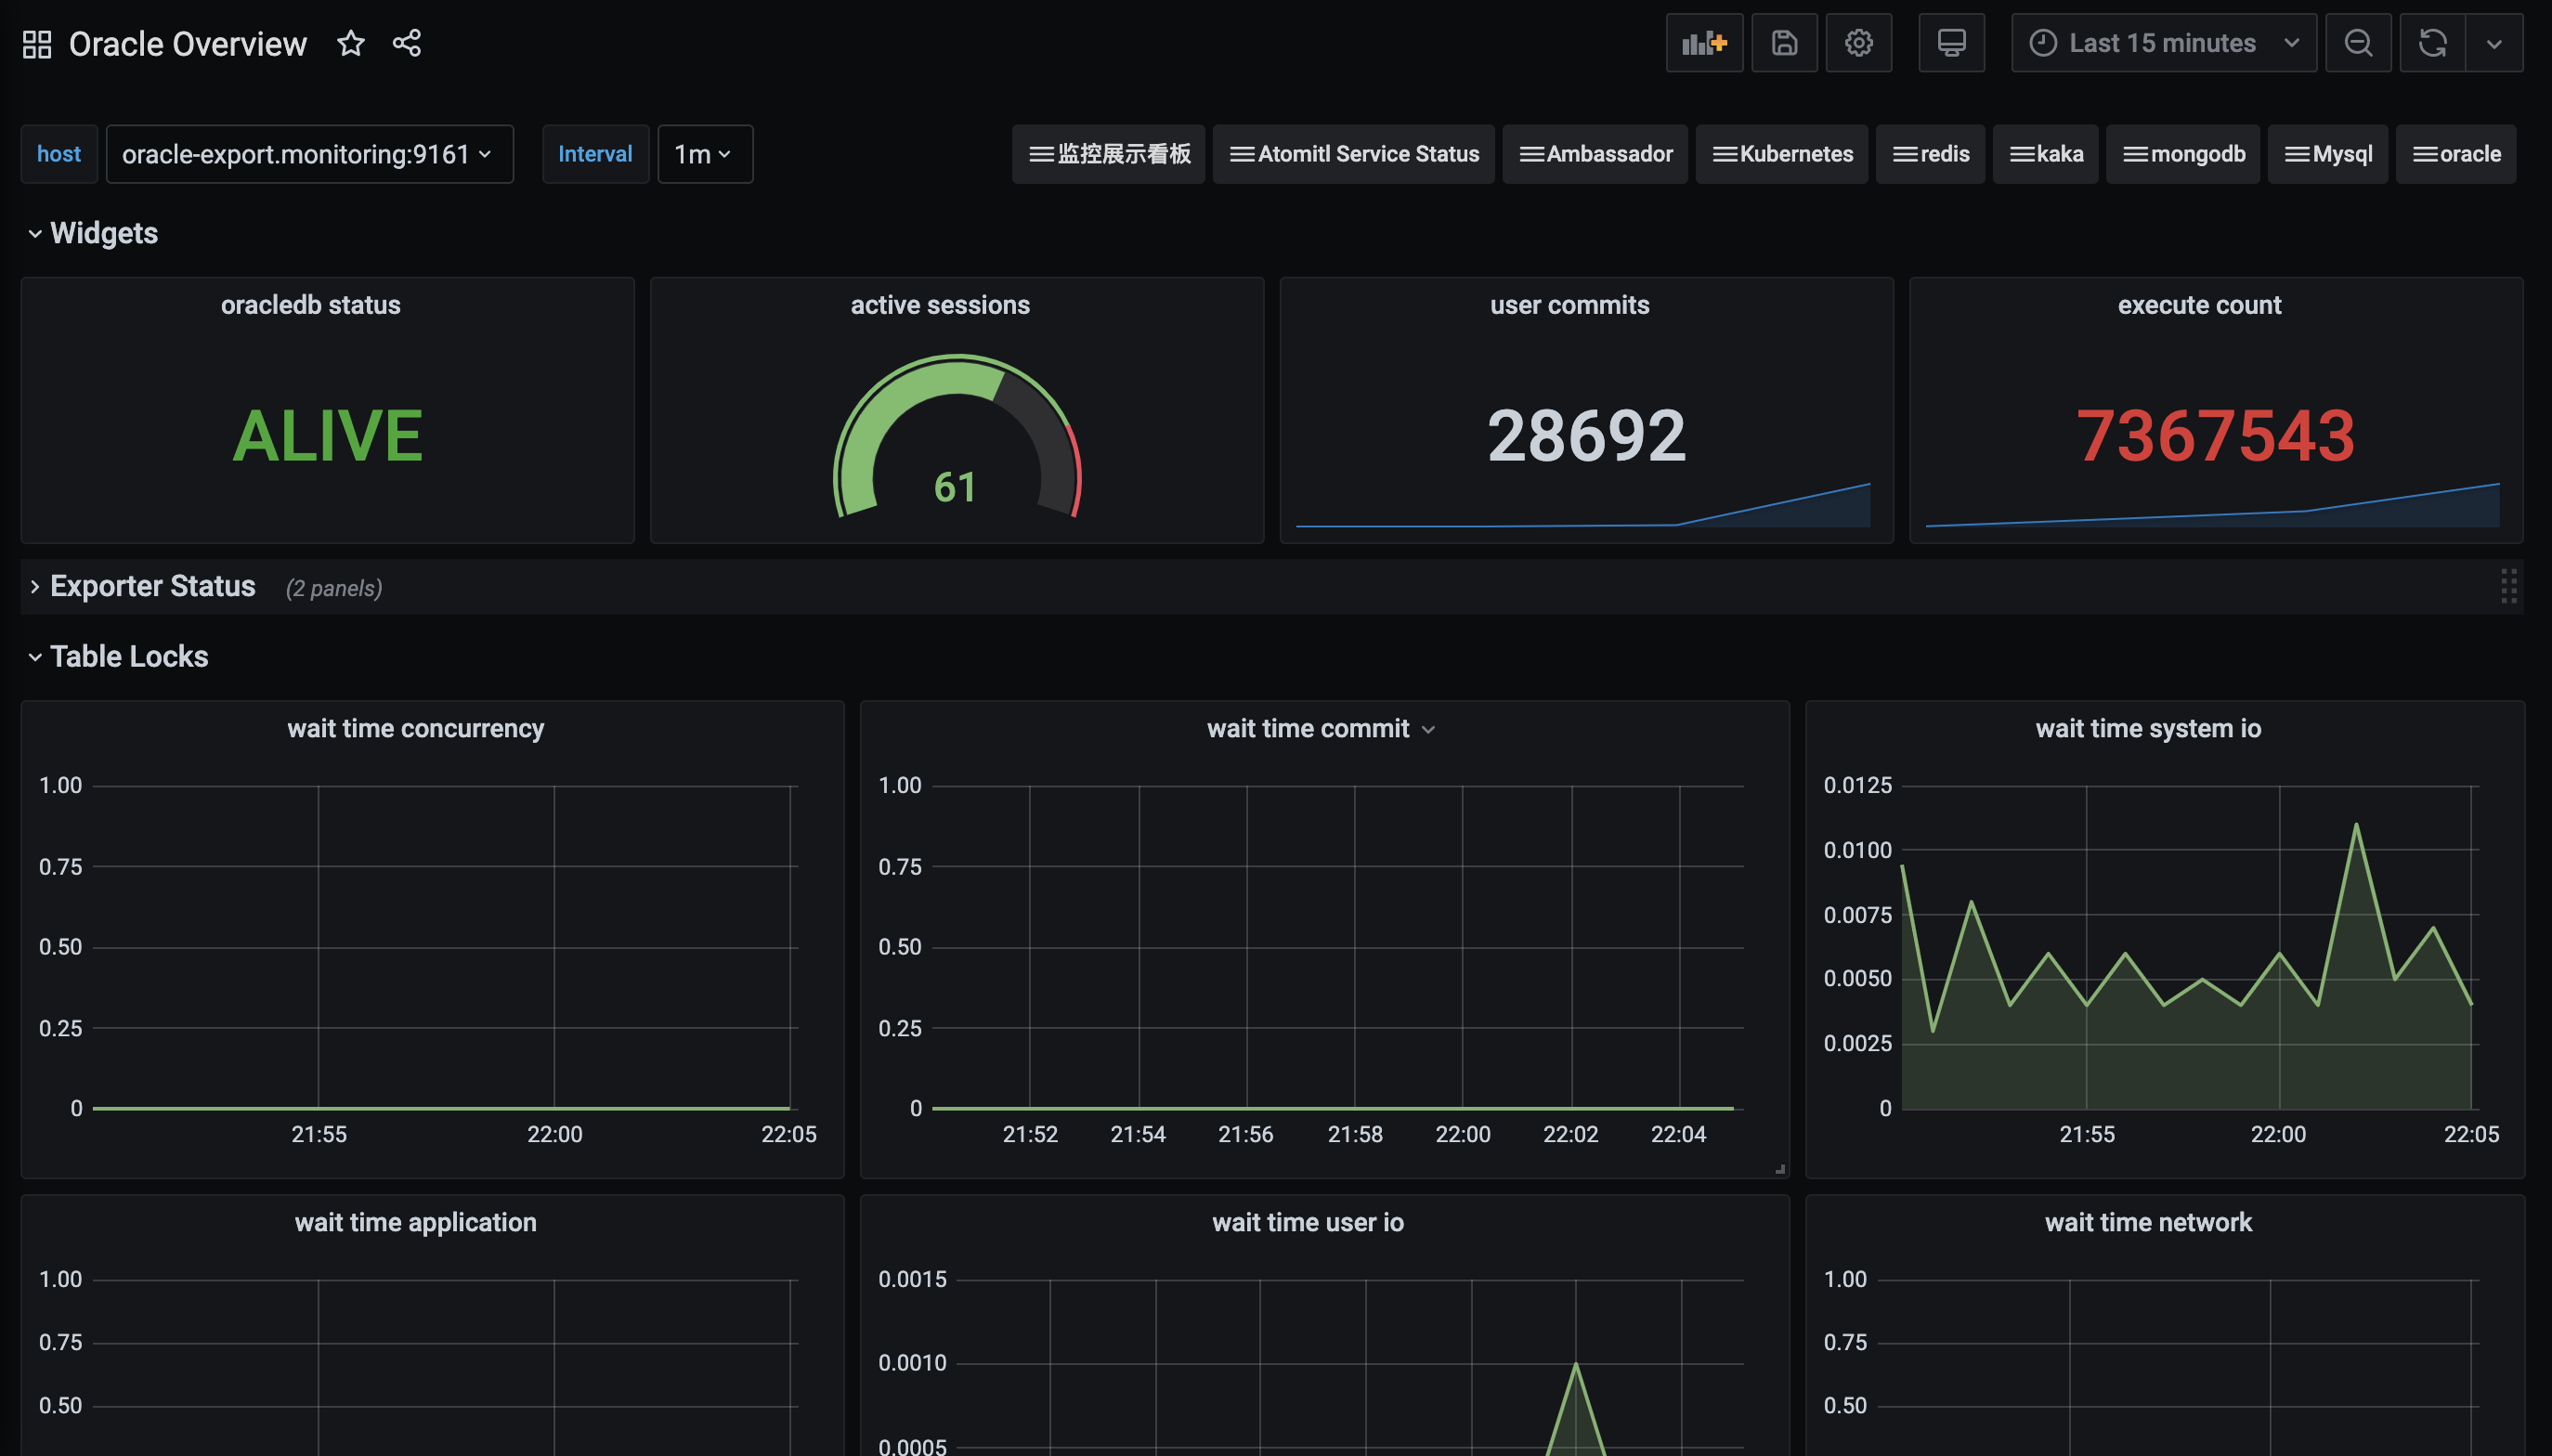
mysql view效果展示:
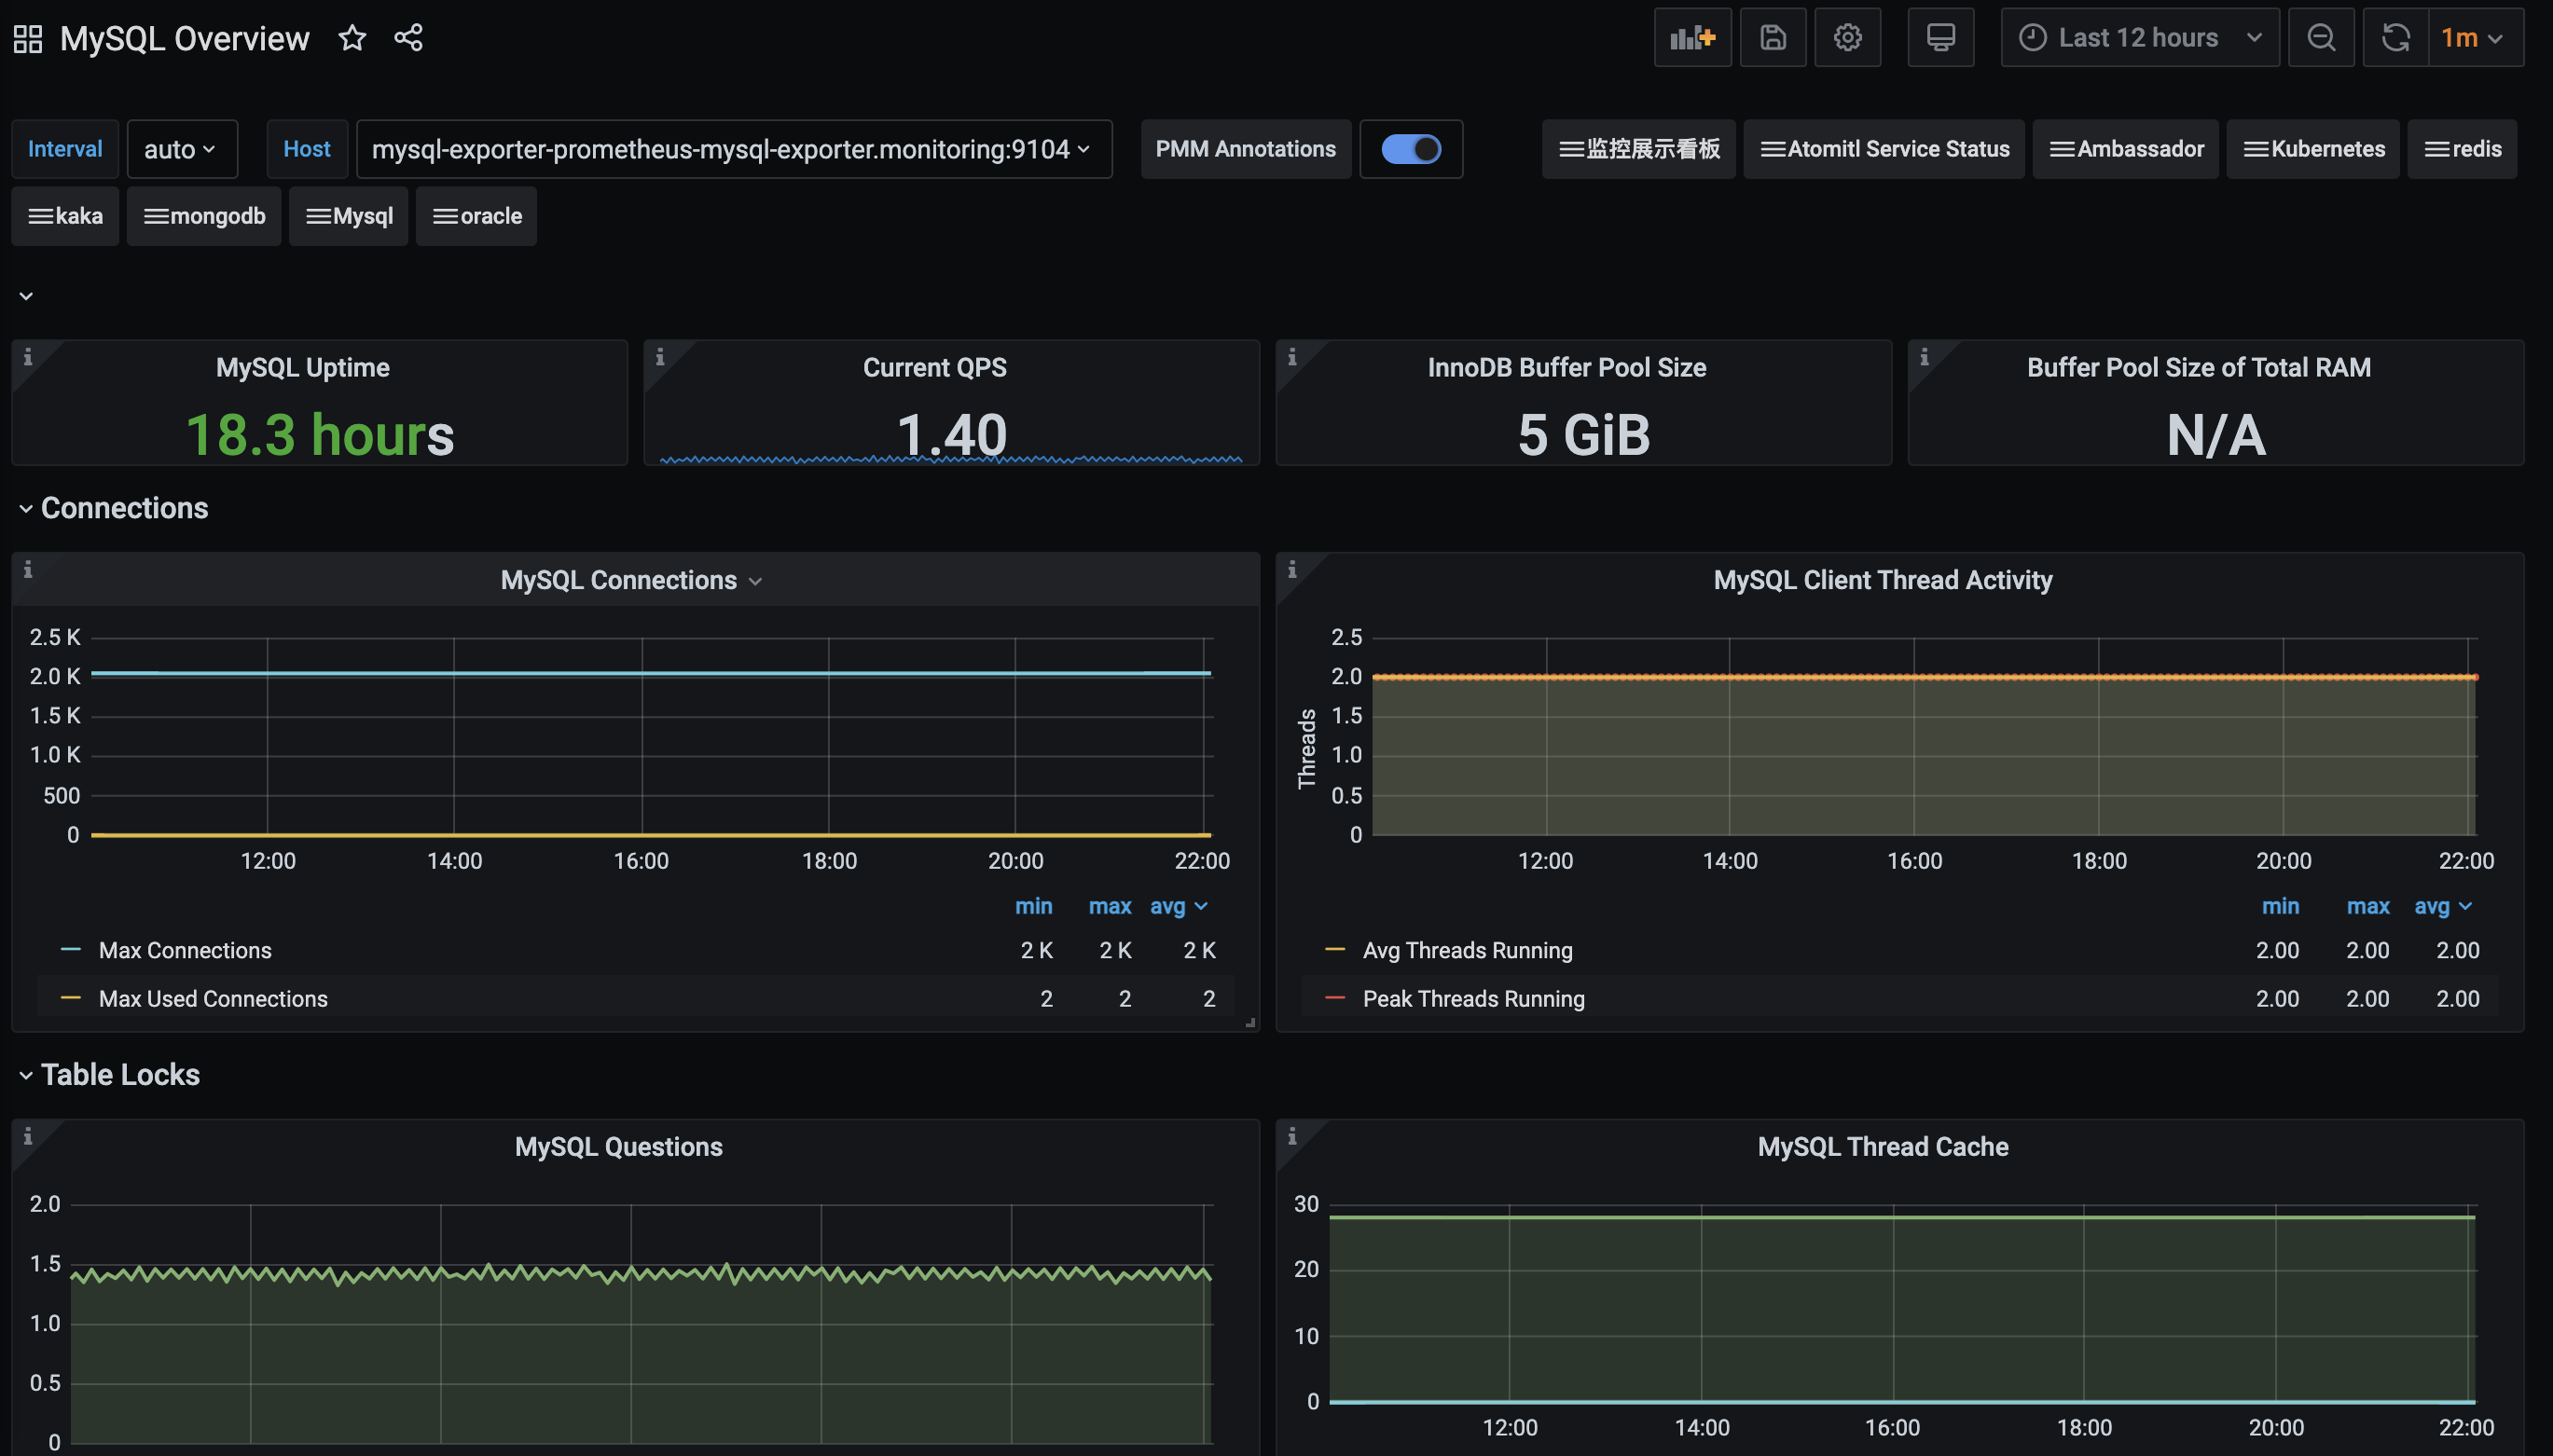
4.添加prometheus的监控告警规则
假定一个oracle的数据库告警记录
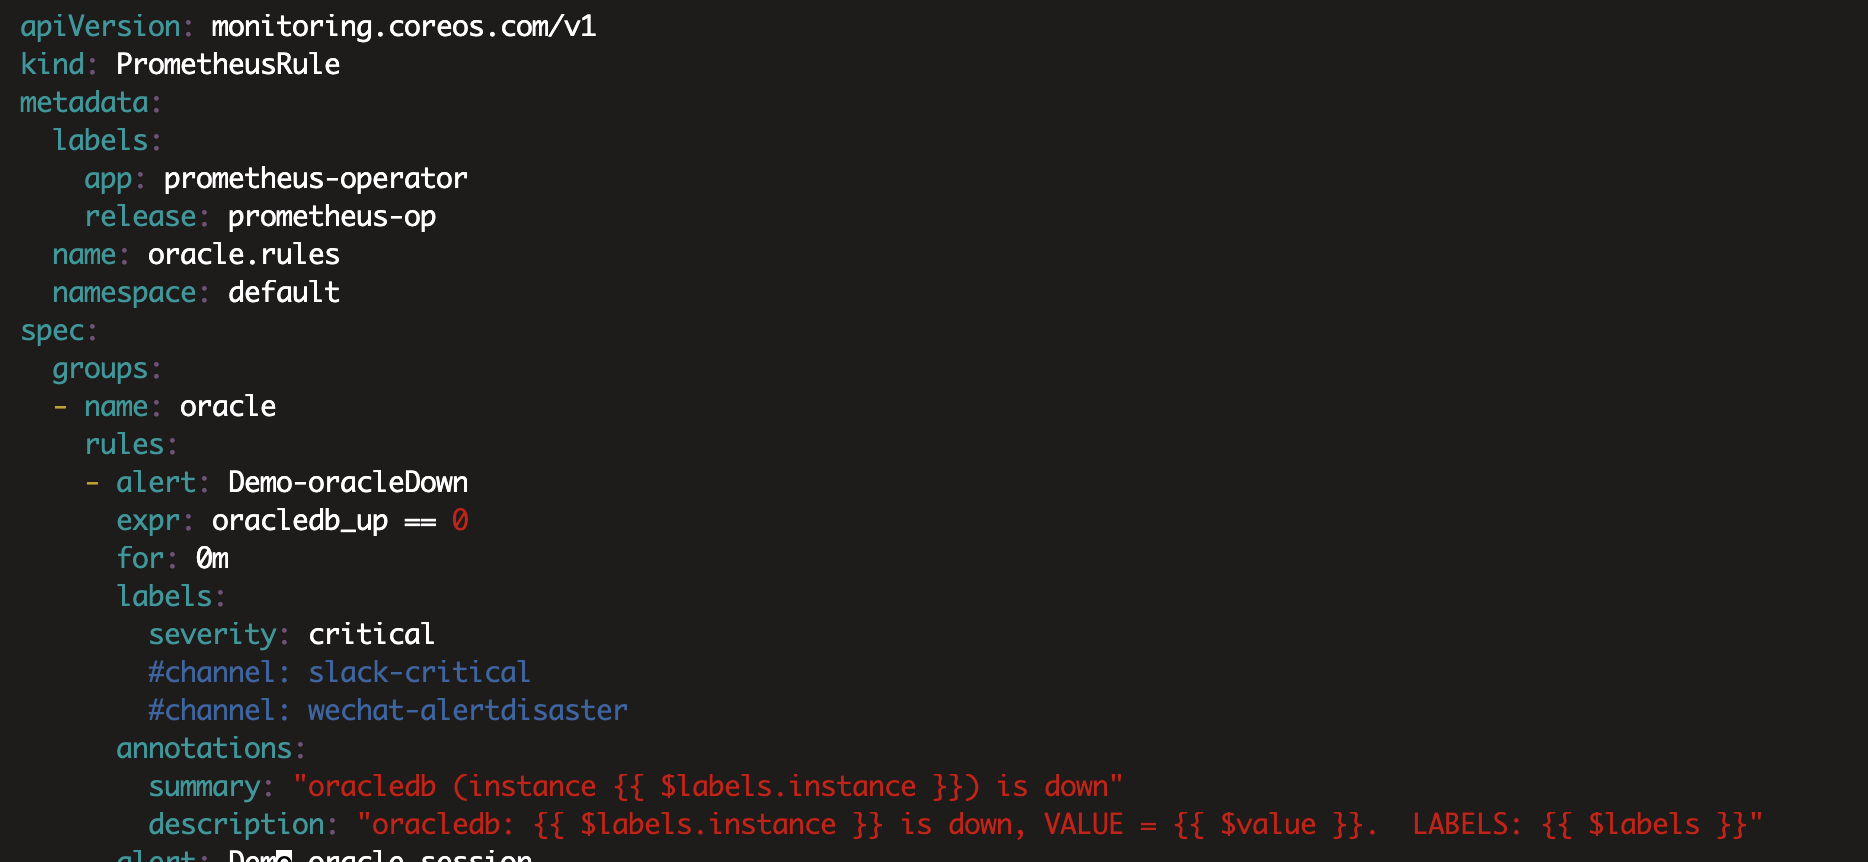
将labels中的app跟prometheus配置文件添加进去进行绑定,后续的所有告警都指定app同样的名称,这样后续所有中间件的告警规则就可以看到了 prometheus-operator
ruleSelector:
      matchLabels:
        app: prometheus-operator
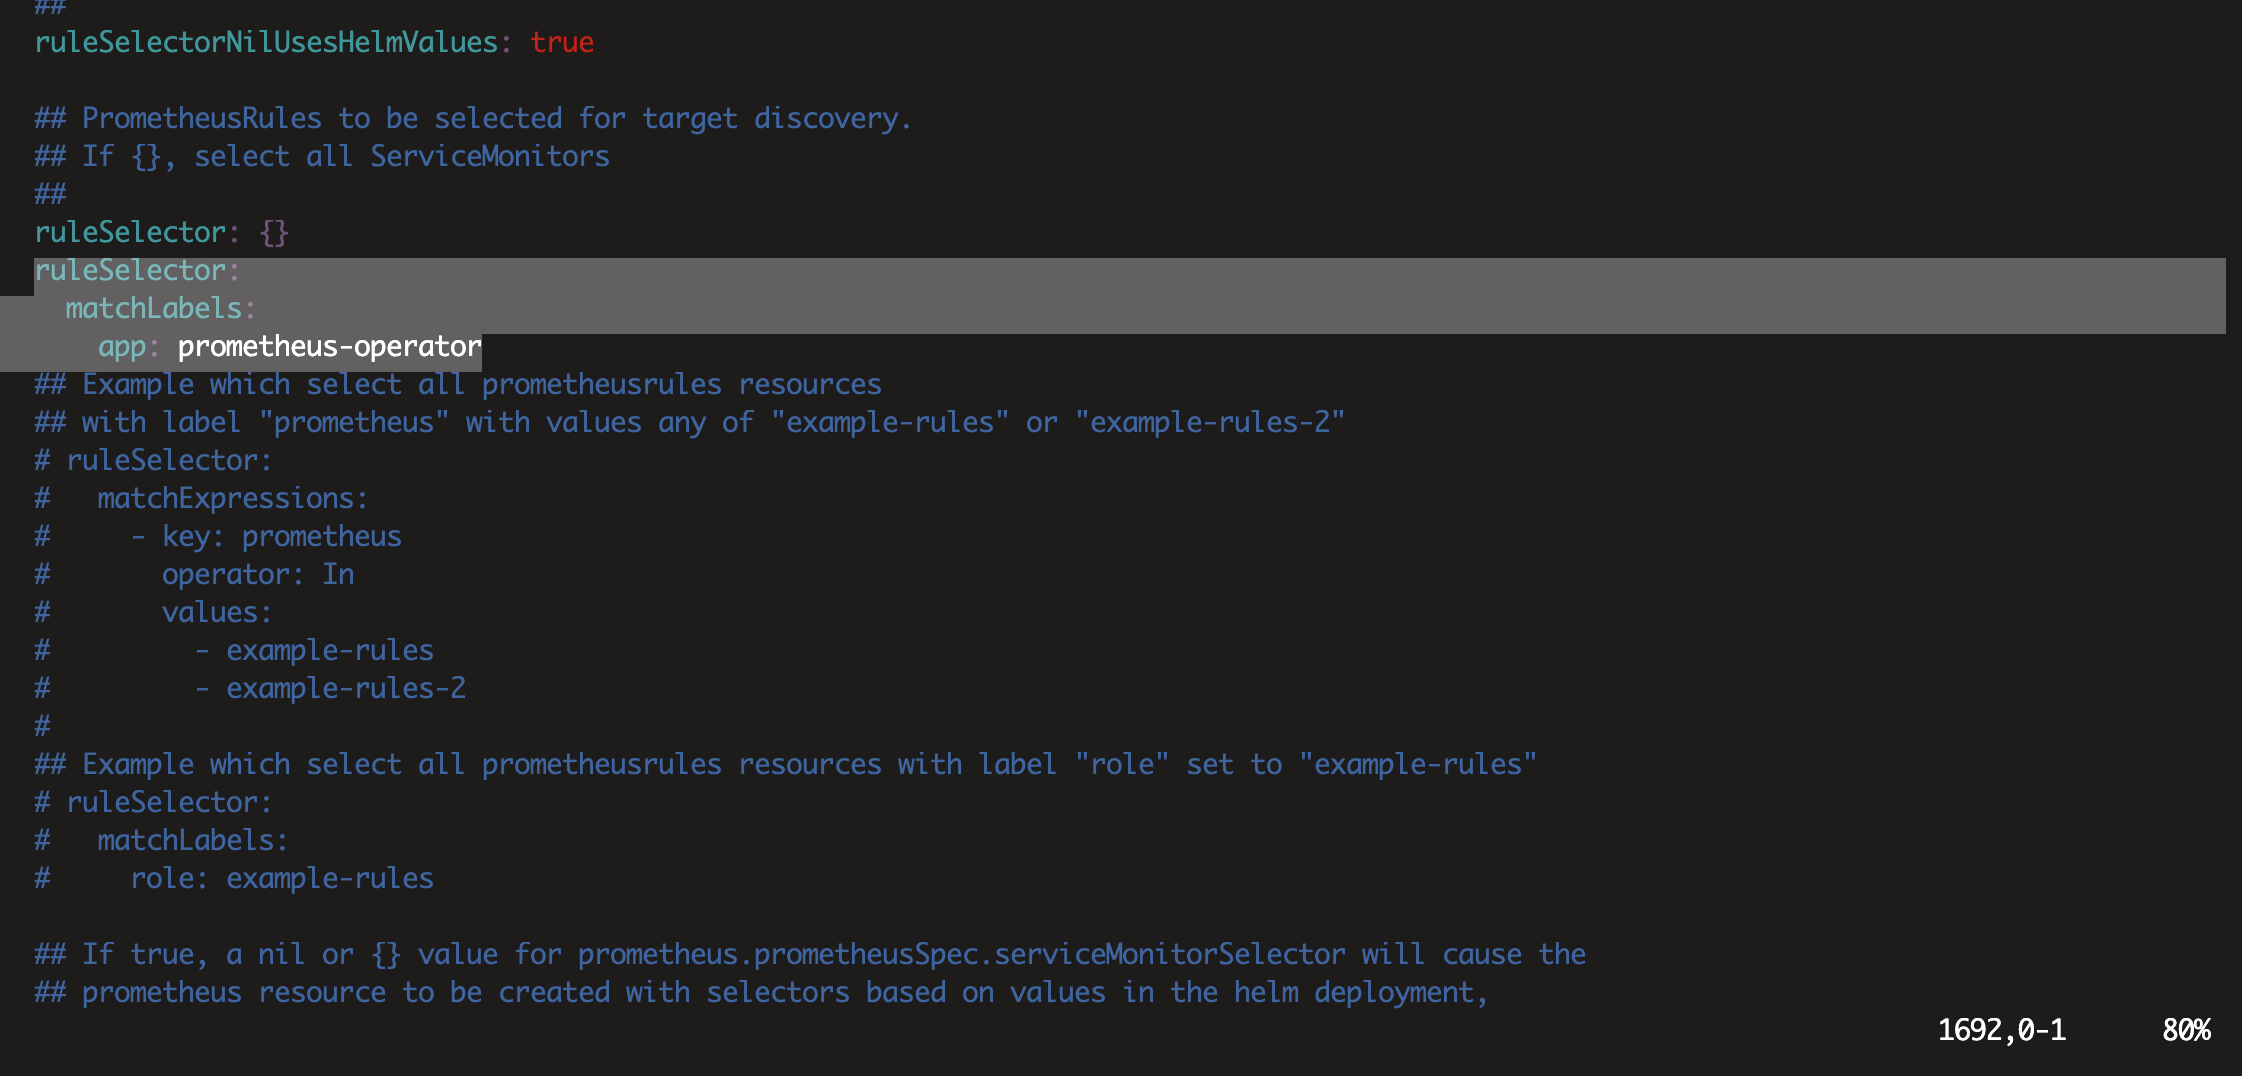
最后告警规则就出现了,如下图所示:
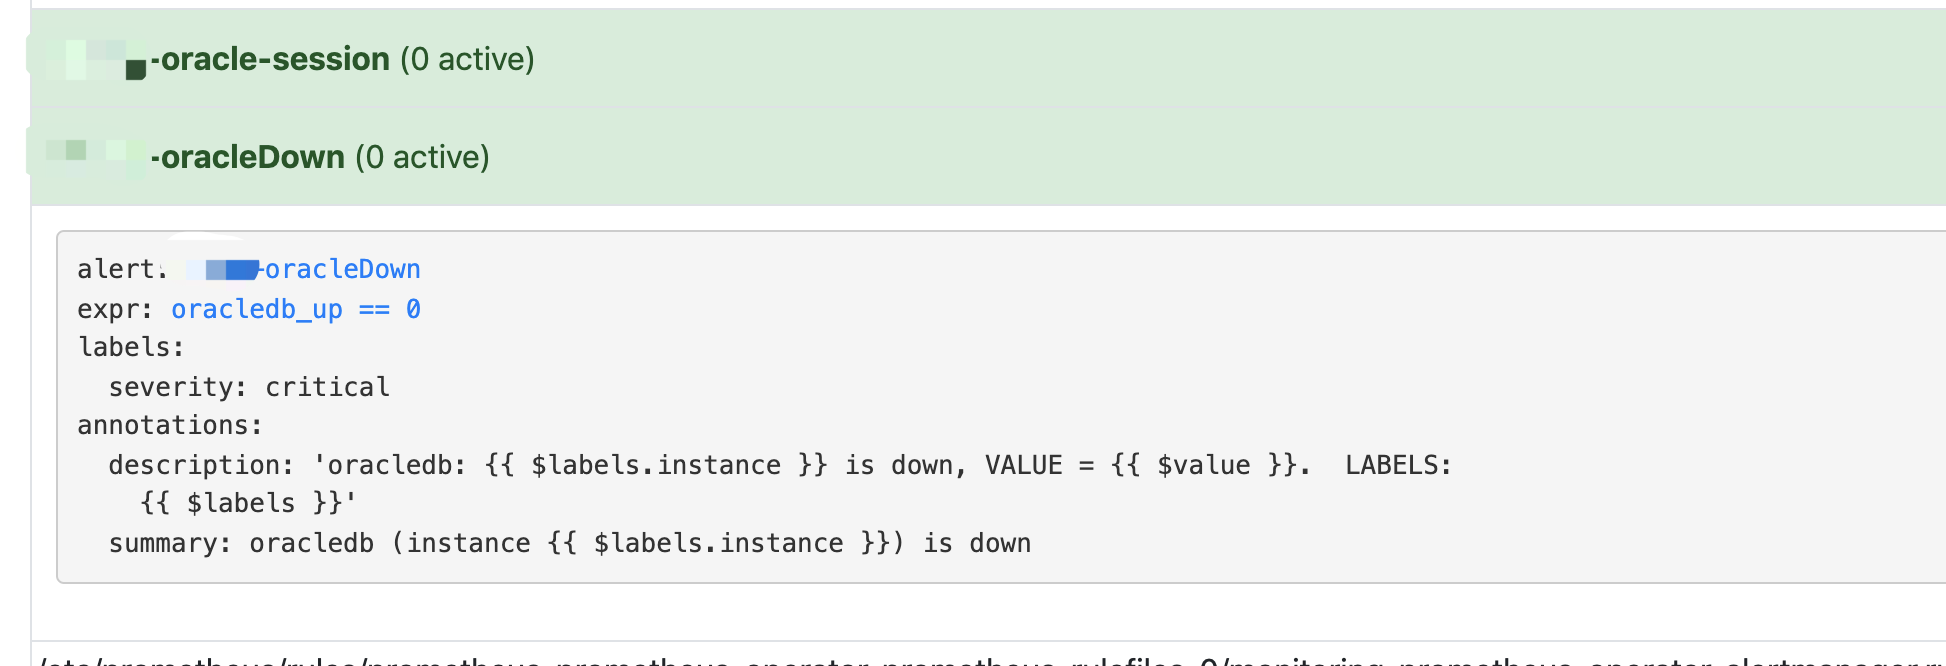
评论区