


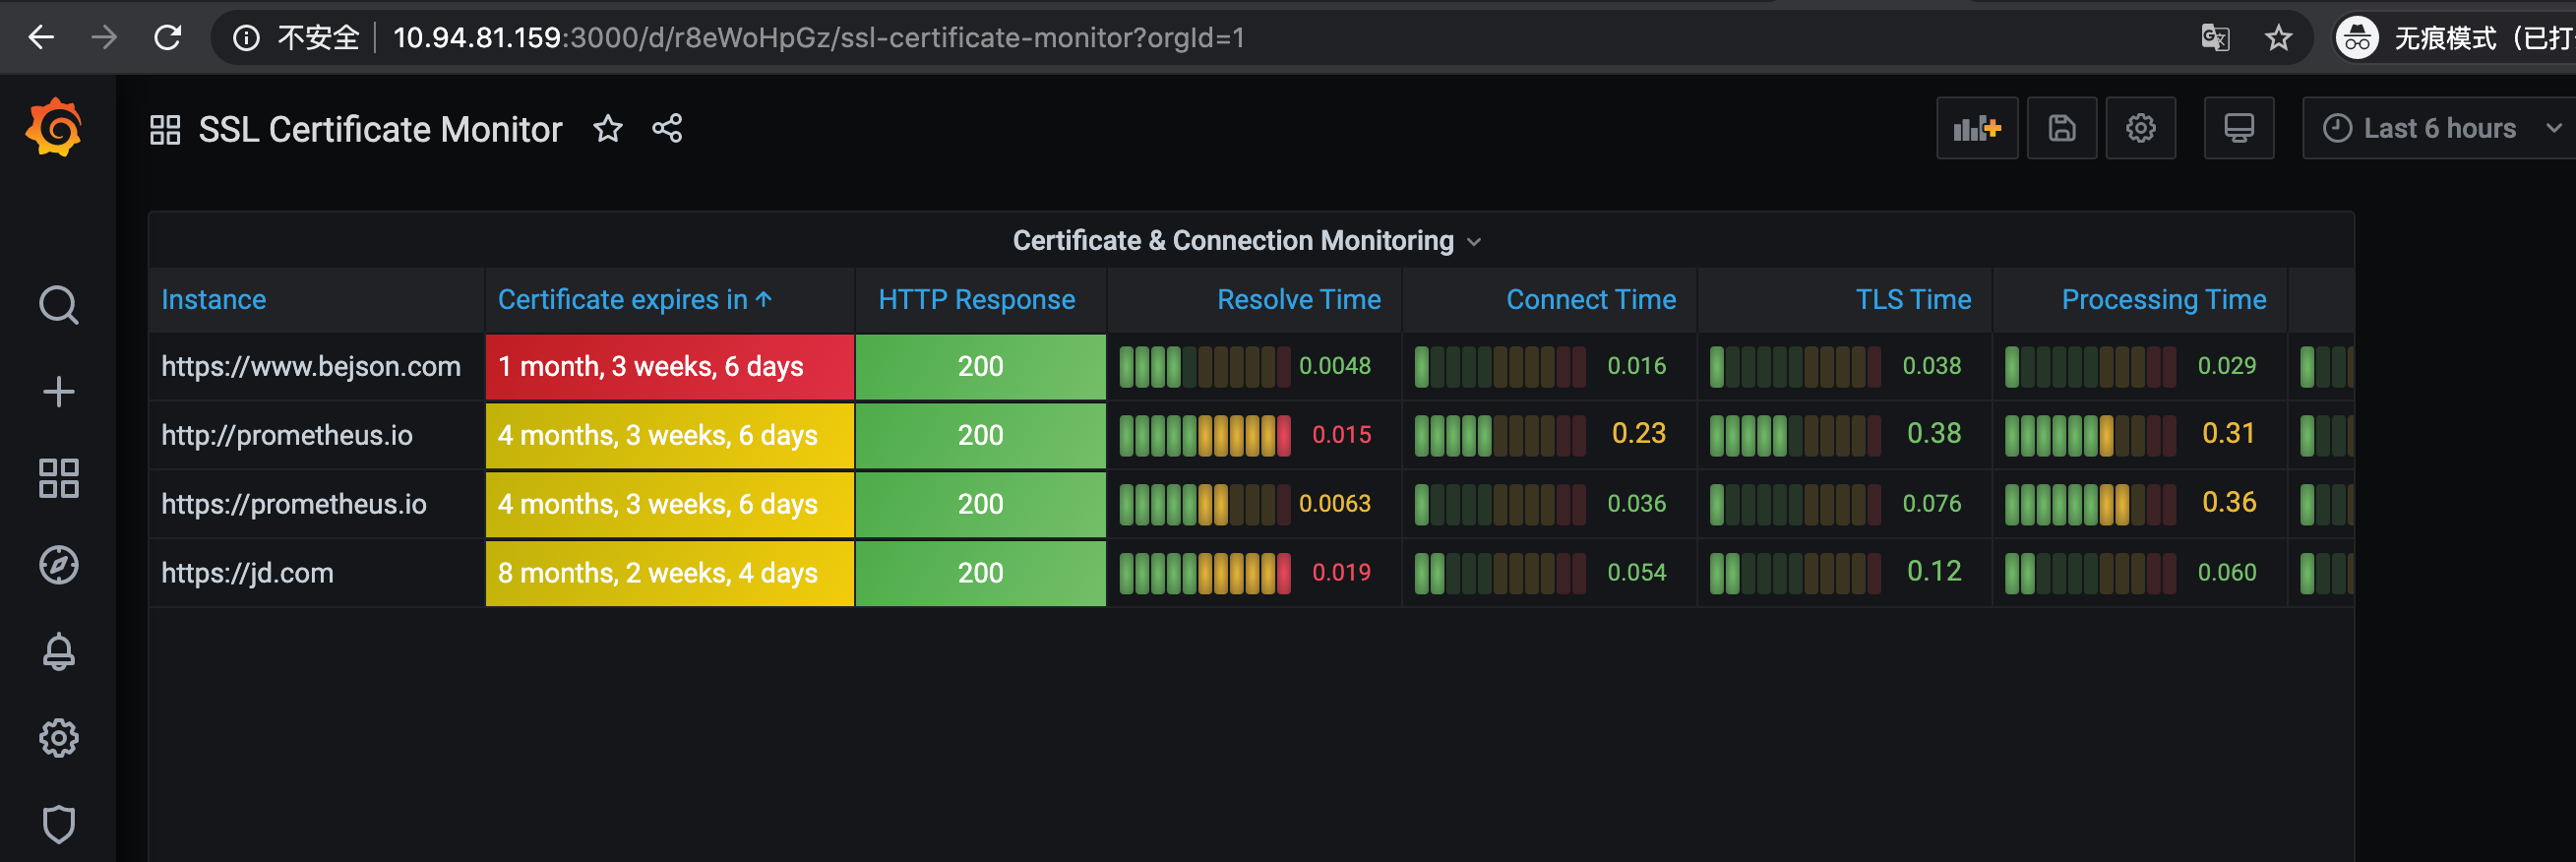
先上效果图:
一.部署blackbox-exporter
Blackbox_exporter是prometheus官方的组件,github地址: https://github.com/prometheus/blackbox_exporter
配置文件使用官方默认的,更多配置可以参考官方example.yml:
[root@localhost blackbox-exporter]# cat blackbox.yml
配置文件如下:
modules:
  http_2xx:  # http 检测模块  Blockbox-Exporter 中所有的探针均是以 Module 的信息进行配置
    prober: http
    timeout: 10s
    http:
      valid_http_versions: ["HTTP/1.1", "HTTP/2"]
      valid_status_codes: [200]  # 这里最好作一个返回状态码,在grafana作图时,有明示---陈刚注释。
      method: GET
      preferred_ip_protocol: "ip4"
  http_post_2xx: # http post 监测模块
    prober: http
    timeout: 10s
    http:
      valid_http_versions: ["HTTP/1.1", "HTTP/2"]
      method: POST
      preferred_ip_protocol: "ip4"
  tcp_connect:  # TCP 检测模块
    prober: tcp
    timeout: 10s
  dns:  # DNS 检测模块
    prober: dns
    dns:
      transport_protocol: "tcp"  # 默认是 udp
      preferred_ip_protocol: "ip4"  # 默认是 ip6
      query_name: "kubernetes.default.svc.cluster.local"
执行命令:
docker run -d \
  -p 9115:9115 \
  --name blackbox_exporter \
  -v /data/blackbox-exporter:/config \
  quay.io/prometheus/blackbox-exporter:latest --config.file=/config/blackbox.yml
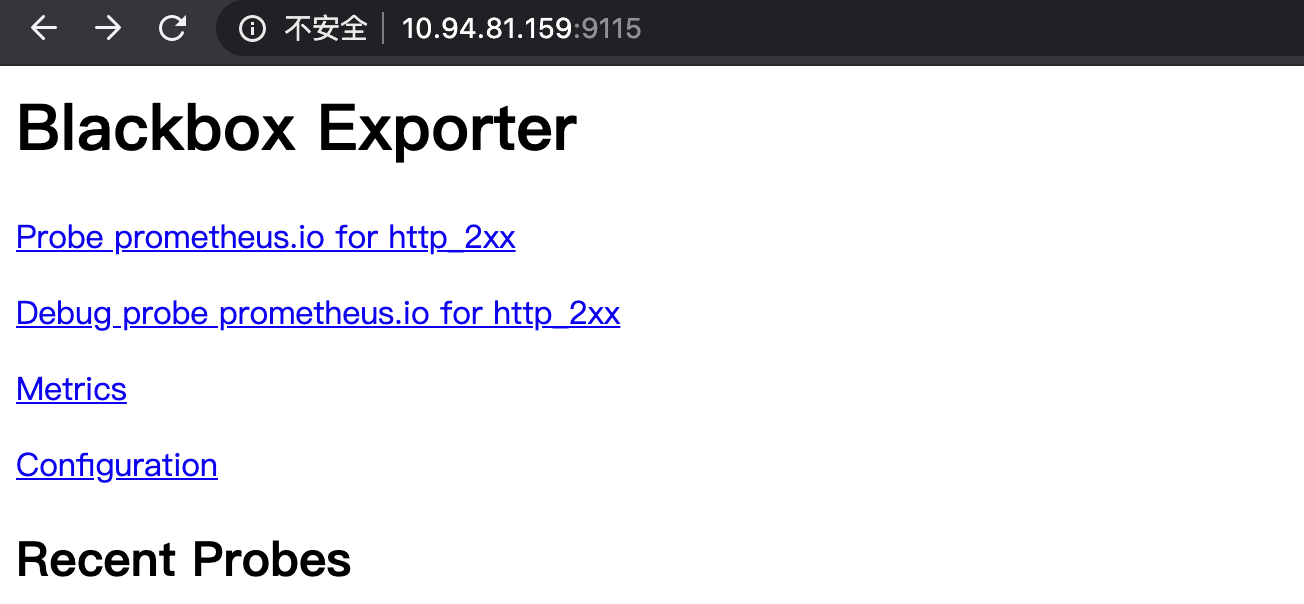
注意,创建/data/blackbox-exporter目录,并把上面的blackbox.yml配置给放进去。启动后测试9115可以正常访问一般就没有问题了。
二.prometheus配置文件里添加job,对blackbox数据进行收集
  - job_name: 'blackbox'
    metrics_path: /probe
    params:
        module: [http_2xx]  # Look for a HTTP 200 response.
    static_configs:
       - targets:
          - https://jumpserver.hotslots777.top    # Target to probe with http.
          - https://gitlab.hotslots777.top # Target to probe with http on port 8080.
    relabel_configs:
       - source_labels: [__address__]
          target_label: __param_target
       - source_labels: [__param_target]
          target_label: instance
       - target_label: __address__
          replacement: 127.0.0.1:9115  # The blackbox exporter's real hostname:port.
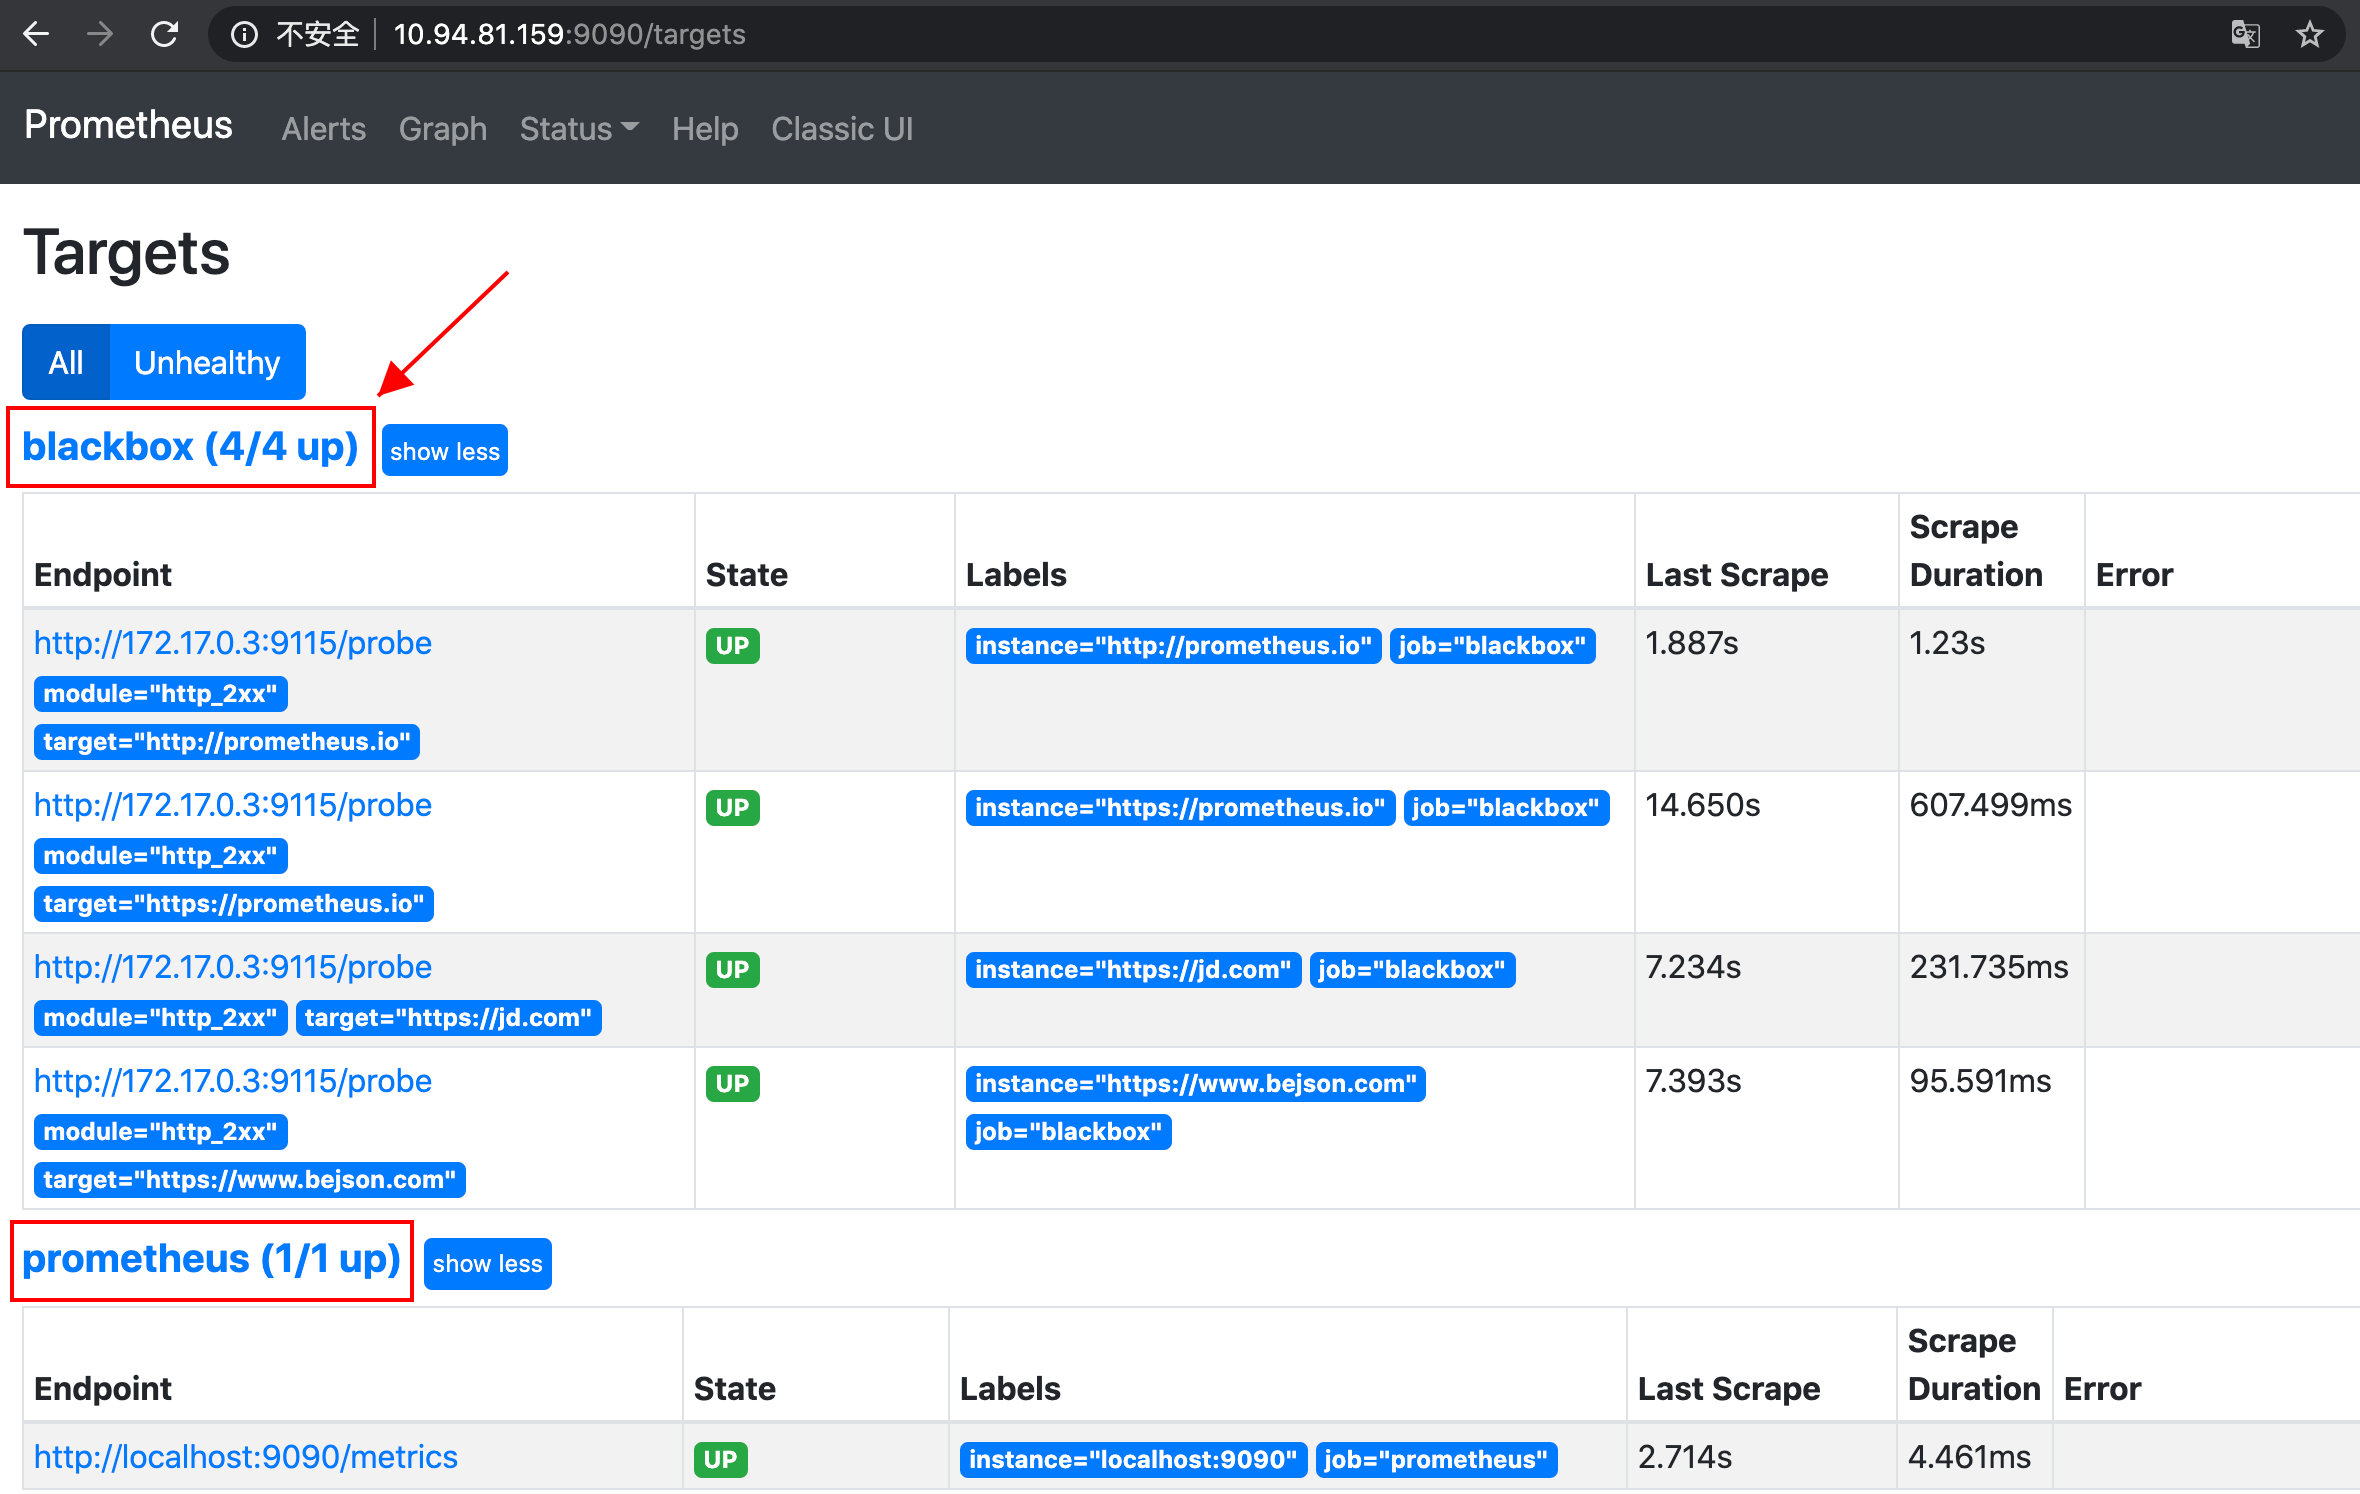
prometheus页面查看target
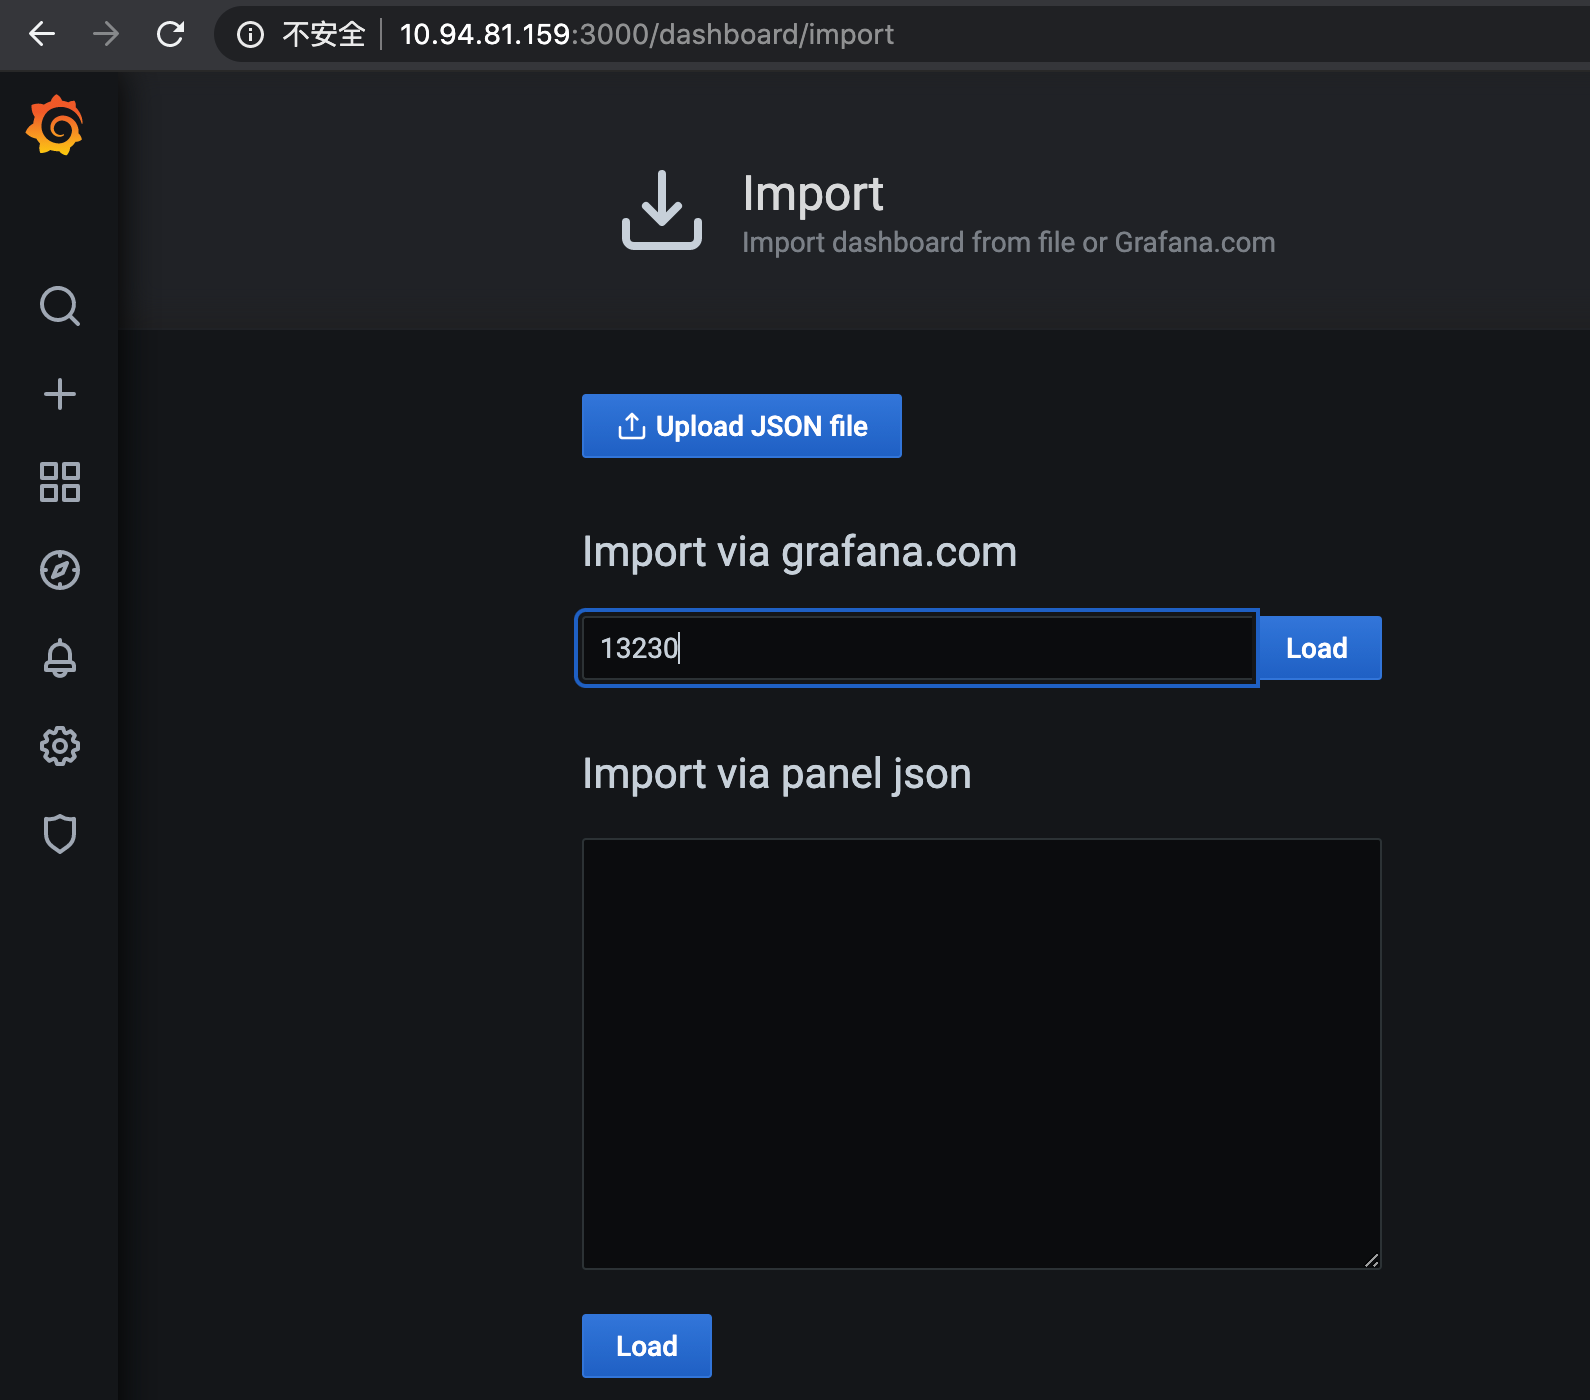
三.prometheus导入dashborad
使用的dashboard是这个: https://grafana.com/grafana/dashboards/13230
四.看效果

五.设置prometheus告警
首先在prometheus.yml文件里面通过定义相关告警规则文件的访问路径

groups:
- name: ssl_expiry
rules:
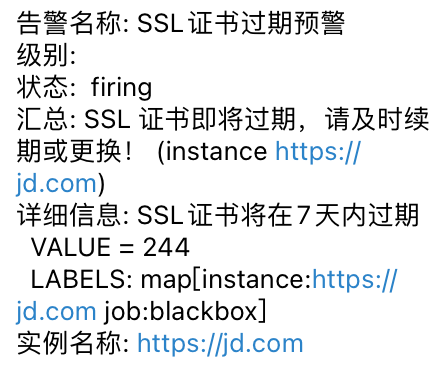
- alert: SSL证书过期预警
expr: round(round(probe_ssl_earliest_cert_expiry - time(),2)/86400,2) < 7
for: 5m
labels:
status: 严重
annotations:
summary: "SSL 证书即将过期,请及时续期或更换! (instance {{ $labels.instance }})"
description: "SSL证书将在7天内过期\n VALUE = {{ $value }}\n LABELS: {{ $labels }}"
重载配置后,在prometheus界面已经可以看到告警了。

效果如下:
评论区